dubicube: Calculation and Interpretation of Data Cube Indicator Uncertainty
![]()


![]()
![]()
![]()
The dubicube package aims to deliver measures for assessing the applicability of biodiversity data cubes, whether for general use or specific biodiversity indicators. These measures facilitate data exploration by providing insights into data quality and reliability. Additionally, the package includes functions for calculating indicator uncertainty using bootstrapping, as well as tools for interpreting and visualising uncertainty in biodiversity indicators derived from occurrence cubes.
Installation
Section titled “Installation”Install dubicube in R:
install.packages("dubicube", repos = c("https://b-cubed-eu.r-universe.dev", "https://cloud.r-project.org"))You can install the development version from GitHub with:
# install.packages("remotes")remotes::install_github("b-cubed-eu/dubicube")The role of dubicube in the indicator calculation workflow
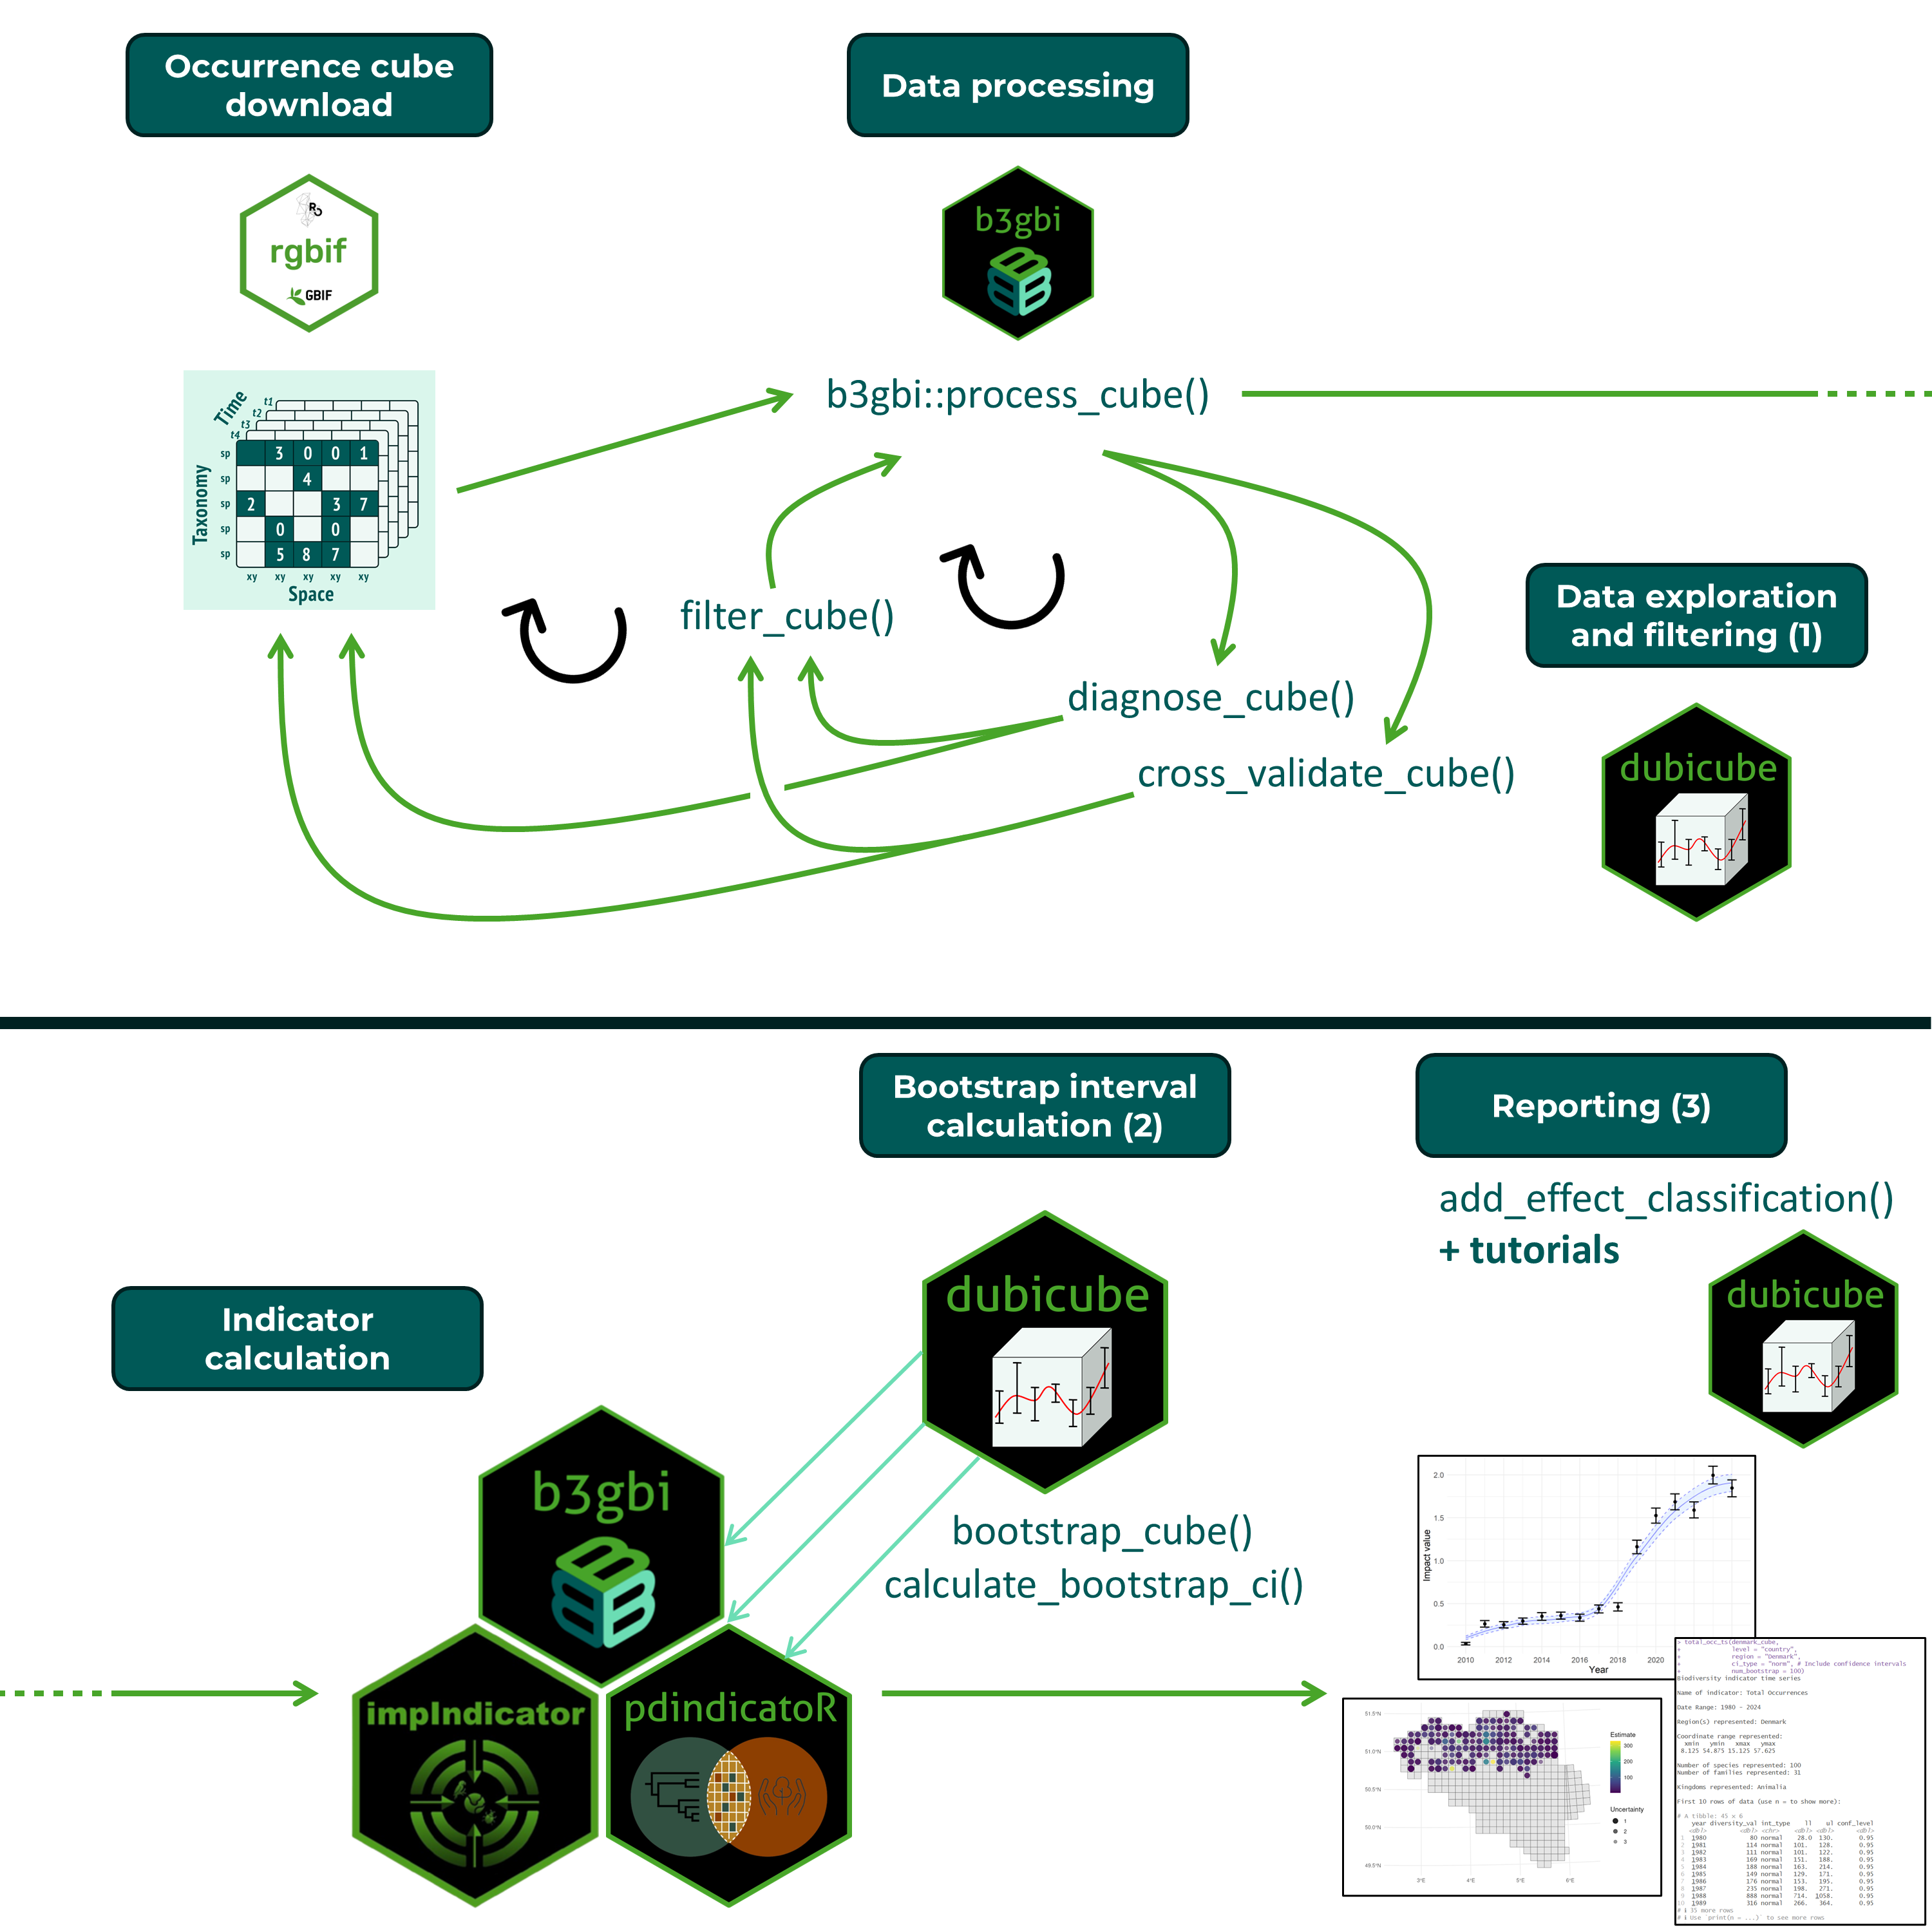
Section titled “The role of dubicube in the indicator calculation workflow”The functionality of the dubicube package is useful throughout the occurrence cube indicator calculation workflow. Occurrence cubes can be created from GBIF data using the rgbif package. They are processed using the process_cube() function from the b3gbi package. This ensures data standardisation and verifies that the cube’s format is correct. dubicube facilitates data exploration and filtering (1) which is an iterative process with cube generation and processing. After a number of iterations, data evaluation is successful and the final data cube can be used for indicator calculation. Indicator calculation packages can use dubicube as a dependency for uncertainty interval calculation via bootstrapping (2) but the package can also be used on its own. Finally, the package provides tools and tutorials to help with indicator visualisation and interpretation (3).
Key Features
Section titled “Key Features”The dubicube package offers:
🔍 1. Data Exploration & Variability Assessment
Section titled “🔍 1. Data Exploration & Variability Assessment”Gain insights into the structure and sensitivity of biodiversity data cubes.
-
diagnose_cube()
Evaluate the quality of a processed data cube by applying a set of diagnostic rules. -
filter_cube()
Remove observations from a processed cube that do not meet defined quality criteria.
📘 Read the tutorial → -
cross_validate_cube()
Perform cross-validation (leave-one-out or k-fold) to assess group-level sensitivity of indicators and evaluate how individual categories influence results.
📘 Read the tutorial →
📈 2. Estimating Indicator Uncertainty
Section titled “📈 2. Estimating Indicator Uncertainty”Use bootstrap methods to understand variability, bias, and confidence in your indicators.
-
bootstrap_cube()
Create bootstrap replicates to estimate indicator variability, bias, and standard error.
📘 Read the tutorial → -
calculate_bootstrap_ci()
Compute confidence intervals (percentile, BCa, normal, basic), with optional transformations and bias correction.
📘 Read the tutorial →
🧠 3. Interpretation & Visualisation
Section titled “🧠 3. Interpretation & Visualisation”Put your results in context with reference values and uncertainty thresholds.
-
add_effect_classification()
Classify indicator trends (e.g. increase, stable, decrease) by comparing confidence intervals to thresholds.
📘 Read the tutorial → -
Spatial and temporal interpretation
Learn how to visualise and assess patterns across space and time using indicator uncertainty.
📘 Best practices for temporal trends →
📘 Best practices for spatial trends →
🔗 Learn more at our website or explore the documentation.