
Predicting Spatial Patterns of Biodiversity Turnover
This vignette focuses on generating spatial predictions from fitted biodiversity-turnover models. The goal is to show how model outputs can be projected across the analysis grid to create continuous spatial layers for mapping and interpretation.
To keep the example reproducible and quick to run, we use a small set of example objects bundled with dissmapr. The setup chunk below loads the required packages, reads the bundled data snapshot, and unpacks the prediction outputs, raster template, species data, and boundary objects needed for spatial prediction.
# Load the packages used in this vignette.library(dissmapr)library(ggplot2)library(dplyr)library(purrr)
# Load the bundled example data snapshot.inputs = readRDS(system.file("extdata", "dissmapr_vignettes.rds", package = "dissmapr"))
# Unpack the example objects used below.grid_spp_pa = inputs$grid_spp_pa           # Presence-absence species dataenv_vars_reduced = inputs$env_vars_reduced # Selected environmental variablesgrid_env = inputs$grid_env                 # Grid-level environmental datasp_cols = inputs$sp_cols                   # Species column nameszeta2 = inputs$zeta2                       # Pairwise zeta-diversity outputispline_gdm_tab = inputs$ispline_gdm_tab   # Fitted I-spline/GDM results tablegrid_spp = inputs$grid_spp                 # Grid-level species datarsa = inputs$rsa                           # South Africa boundaryall_preds = inputs$all_preds
1. Predict current Zeta Diversity (zeta2) using predict_dissim()
Section titled “1. Predict current Zeta Diversity (zeta2) using predict_dissim()”In this step we use our fitted order-2 GDM (zeta2) to generate a spatial map of pairwise compositional turnover (ζ₂) under current conditions. By calling predict_dissim() we
- compute each site’s sampling‐effort‐adjusted species richness and mean distance to all other sites;
- apply the same environmental I-spline transformations used in the model;
- predict the Jaccard-scaled turnover (ζ₂) on the 0–1 scale;
- optionally plot the resulting heatmap with your study boundary overlaid.
We set a random seed for reproducibility (so Monte Carlo sampling inside predict_dissim() yields the same results each time), pull out just the species columns once, then inspect the returned predictors_df to confirm its dimensions, column names, and a quick peek at the key model outputs.
# Predict current zeta diversity using `predict_dissim` with sampling effort, geographic distance and environmental variables# Only non-colinear environmental variables used in `zeta2` modelset.seed(123) # set.seed to generate exactly the same random results i.e. sam=100spp_cols = names(grid_spp_pa[,-(1:6)])predictors_df = dissmapr::predict_dissim( grid_spp = grid_spp_pa, species_cols = spp_cols, env_vars = env_vars_reduced,# env_vars_reduced[,-8] zeta_model = zeta2, # From simple order 2 run above # zeta_model = ispline_gdm_tab$zeta_gdm_list[[1]], # From list of Zeta.msgdm models grid_xy = grid_env, x_col = "centroid_lon", y_col = "centroid_lat", bndy_fc = rsa, # Optional feature collection to plot as boundary show_plot = TRUE)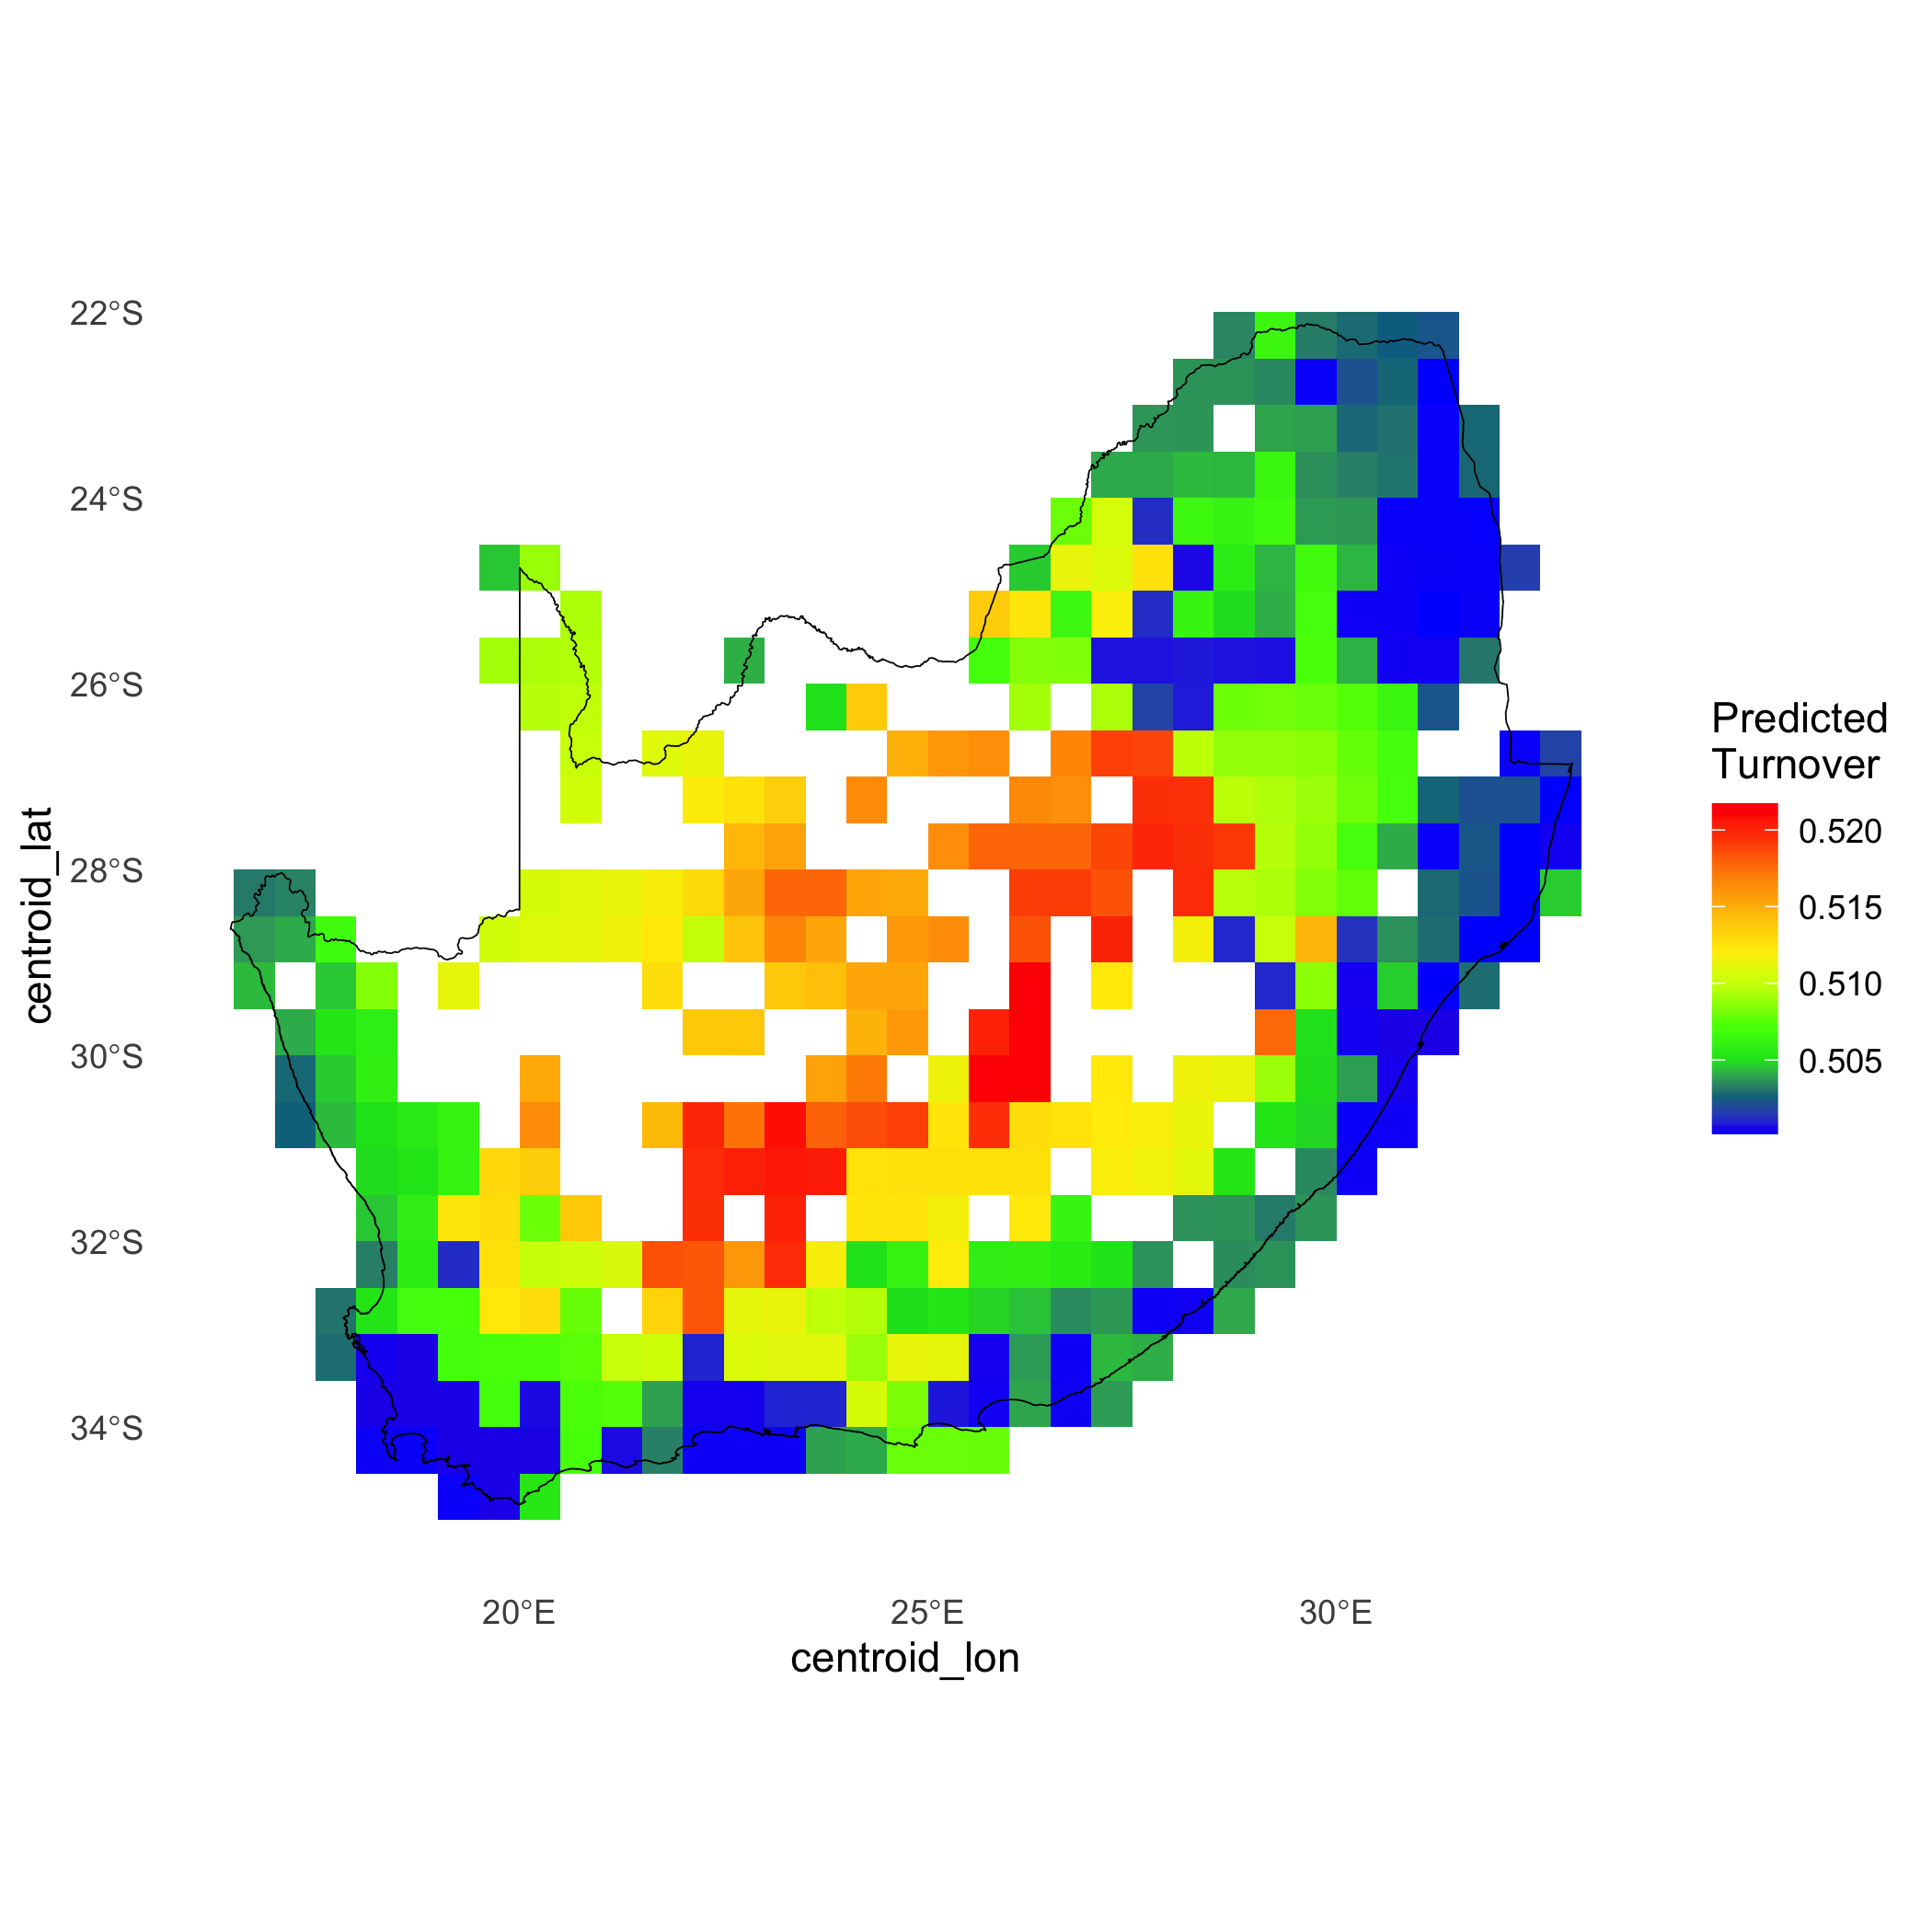
# Check resultsdim(predictors_df)#> [1] 415 14names(predictors_df)#> [1] "temp_mean" "iso" "temp_wetQ" "temp_dryQ"#> [5] "rain_dry" "rain_warmQ" "obs_sum" "distance"#> [9] "richness" "pred_zeta" "pred_zetaExp" "log_pred_zetaExp"#> [13] "centroid_lon" "centroid_lat"head(predictors_df[,5:11])#> rain_dry rain_warmQ obs_sum distance richness pred_zeta pred_zetaExp#> 1 -1.171906 -0.2222718 -0.2926985 903.0437 2 0.013475636 0.5033689#> 2 -1.171906 -0.1743223 -0.2340532 915.4655 31 0.025543916 0.5063856#> 3 -1.051673 0.1852987 -0.2818954 931.1100 10 0.012838967 0.5032097#> 4 -1.171906 0.2572229 -0.2865253 949.9390 7 0.011283704 0.5028209#> 5 -1.051673 0.4889786 -0.2880686 971.8672 6 0.010089501 0.5025224#> 6 -1.051673 0.5449196 -0.1321955 996.7561 76 0.009101051 0.50227522. Predict future Zeta Diversity using predict_dissim()
Section titled “2. Predict future Zeta Diversity using predict_dissim()”Below we expand our workflow to forecast how ζ₂ respond to three extreme climate futures (2030, 2040, 2050) alongside the current scenario.
First, we define and center-scale each future by adding large temperature increments and rainfall multipliers, then bundle them into a named list of four environmental data frames:
# 1. Identify species & env columns# spp_cols  = names(grid_spp_pa)[-(1:6)]all_vars  = names(env_vars_reduced)temp_vars = grep("^temp", all_vars, value = TRUE)rain_vars = grep("^rain", all_vars, value = TRUE)iso_vars = grep("^iso", all_vars, value = TRUE)obs_var = "obs_sum"
# 2. Extreme future shiftshorizons     = c("2030","2040","2050")mean_delta   = list(  temp  = c("2030"= +2,  "2040"= +4,  "2050"= +6),  iso   = c("2030"= +0.5,"2040"= +1.0,"2050"= +1.5),  rain  = c("2030"= 0.9, "2040"= 0.8, "2050"= 0.7),  effort= c("2030"= 1.3, "2040"= 1.6, "2050"= 2.0))exagg_factor = c("2030"=1.5, "2040"=2.0, "2050"=2.5)
# 3) helper to amplify deviation from the meanamplify = function(x, factor) {  m = mean(x, na.rm=TRUE)  m + (x - m) * factor}
# # 4. Save original scaling parameters# sc_params = scale(env_vars_reduced)# mu    = attr(sc_params, "scaled:center")# sigma = attr(sc_params, "scaled:scale")
# 4. Build list of future env tibblesenv_scenarios = c(  list(current = env_vars_reduced),  map(horizons, function(yr) {    df = env_vars_reduced    # mean shifts    df[temp_vars] = df[temp_vars] + mean_delta$temp[yr]    df[iso_vars]  = df[iso_vars]  + mean_delta$iso[yr]    df[rain_vars] = df[rain_vars] * mean_delta$rain[yr]    df[[obs_var]] = df[[obs_var]] * mean_delta$effort[yr]    # amplify spatial variation    df[temp_vars] = map_dfc(df[temp_vars], amplify, factor = exagg_factor[yr])    df[iso_vars]  = map_dfc(df[iso_vars],  amplify, factor = exagg_factor[yr])    # clamp obs_sum    df[[obs_var]] = pmin(pmax(df[[obs_var]], 50), 8000)    df  }) |> set_names(horizons))#> Error in `numeric()`:#> ! invalid 'length' argument# names(env_scenarios) = names(horizons)
# 5. Prepend current conditions# env_scenarios = c(list(current = env_vars_reduced), env_futures)str(env_scenarios, max.level = 1)#> Error:#> ! object 'env_scenarios' not found
Or use fixed baseline scaling instead
Section titled “Or use fixed baseline scaling instead”The future scenarios should be scaled using the current/training means and standard deviations, not their own means and standard deviations. These parameters must match those used when fitting zeta2.
# # Baseline scaling parameters# env_center = vapply(# env_vars_reduced,# mean,# numeric(1),# na.rm = TRUE# )## env_scale = vapply(# env_vars_reduced,# sd,# numeric(1),# na.rm = TRUE# )## stopifnot(# all(is.finite(env_scale)),# all(env_scale > 0)# )## scale_from_baseline = function(df, center, scale) {# x = as.matrix(df)## x = sweep(# x,# MARGIN = 2,# STATS = center[colnames(x)],# FUN = "-"# )## x = sweep(# x,# MARGIN = 2,# STATS = scale[colnames(x)],# FUN = "/"# )## as.data.frame(x, check.names = FALSE)# }## env_scenarios_scaled = purrr::map(# env_scenarios,# scale_from_baseline,# center = env_center,# scale = env_scale# )Next, we loop through each scenario, re-apply the original centering and scaling, and call our predict_dissim() helper to compute ζ₂. We tag each result with its scenario name and combine them into one tidy data frame:
set.seed(123)
scenario_dfs = purrr::imap(env_scenarios, ~ {  df = dissmapr::predict_dissim(    grid_spp     = grid_spp,    species_cols = spp_cols,    env_vars     = .x,    zeta_model   = zeta2,    grid_xy      = grid_env,    x_col        = "centroid_lon",    y_col        = "centroid_lat",    skip_scale   = FALSE,    show_plot    = FALSE  )  df$scenario = .y  df})#> Error:#> ! object 'env_scenarios' not foundstr(scenario_dfs, max.level=1)#> Error:#> ! object 'scenario_dfs' not found
# # fixed baseline scaling# scenario_dfs = purrr::imap(env_scenarios_scaled, \(scenario_env, scenario_name) {#   result = dissmapr::predict_dissim(#     grid_spp     = grid_spp,#     species_cols = spp_cols,#     env_vars     = scenario_env,#     zeta_model   = zeta2,#     grid_xy      = grid_env,#     x_col        = "centroid_lon",#     y_col        = "centroid_lat",#     skip_scale   = TRUE,#     show_plot    = FALSE#   )##   result$scenario = scenario_name#   result# })# # str(scenario_dfs, max.level=1)
# all_preds = bind_rows(scenario_dfs) %>%#   mutate(scenario = factor(scenario, levels = c("current", names(temp_shifts))))all_preds = dplyr::bind_rows(scenario_dfs)#> Error:#> ! object 'scenario_dfs' not foundhead(all_preds)#>   temp_mean         iso temp_wetQ temp_dryQ  rain_dry rain_warmQ    obs_sum distance richness#> 1  1.730095  0.01726121  1.386855 0.5441361 -1.171906 -0.2222718 -0.2926985 903.0437        3#> 2  1.683898 -0.53540287  1.471251 0.4496825 -1.171906 -0.1743223 -0.2340532 915.4655       41#> 3  1.589813  0.21693689  1.234714 0.5570195 -1.051673  0.1852987 -0.2818954 931.1100       10#> 4  2.185359  0.69302984  1.511219 0.9937463 -1.171906  0.2572229 -0.2865253 949.9390        7#> 5  2.418605  1.23977219  1.589519 1.2042260 -1.051673  0.4889786 -0.2880686 971.8672        6#> 6  2.810088  1.89130325  1.817424 1.4313345 -1.051673  0.5449196 -0.1321955 996.7561      107#>     pred_zeta pred_zetaExp log_pred_zetaExp centroid_lon centroid_lat scenario#> 1 0.013475636    0.5033689       -0.6864321        28.75    -22.25004  current#> 2 0.025543916    0.5063856       -0.6804568        29.25    -22.25004  current#> 3 0.012838967    0.5032097       -0.6867483        29.75    -22.25004  current#> 4 0.011283704    0.5028209       -0.6875212        30.25    -22.25004  current#> 5 0.010089501    0.5025224       -0.6881152        30.75    -22.25004  current#> 6 0.009101051    0.5022752       -0.6886070        31.25    -22.25004  current
We can then quickly compare the spatial ζ₂ surfaces under each future:
ggplot(all_preds, aes(centroid_lon, centroid_lat, fill = pred_zetaExp)) + geom_tile() + facet_wrap(~ scenario, ncol = 2) + scale_fill_viridis_c(direction = -1, name = expression(zeta[2])) + geom_sf(data = rsa, fill = NA, color = "black", inherit.aes = FALSE) + coord_sf() + labs(x = "Longitude", y = "Latitude", title = expression("Predicted ζ"[2] * " under current & future scenarios")) + theme_minimal() + theme(strip.text = element_text(face = "bold"), panel.grid = element_blank())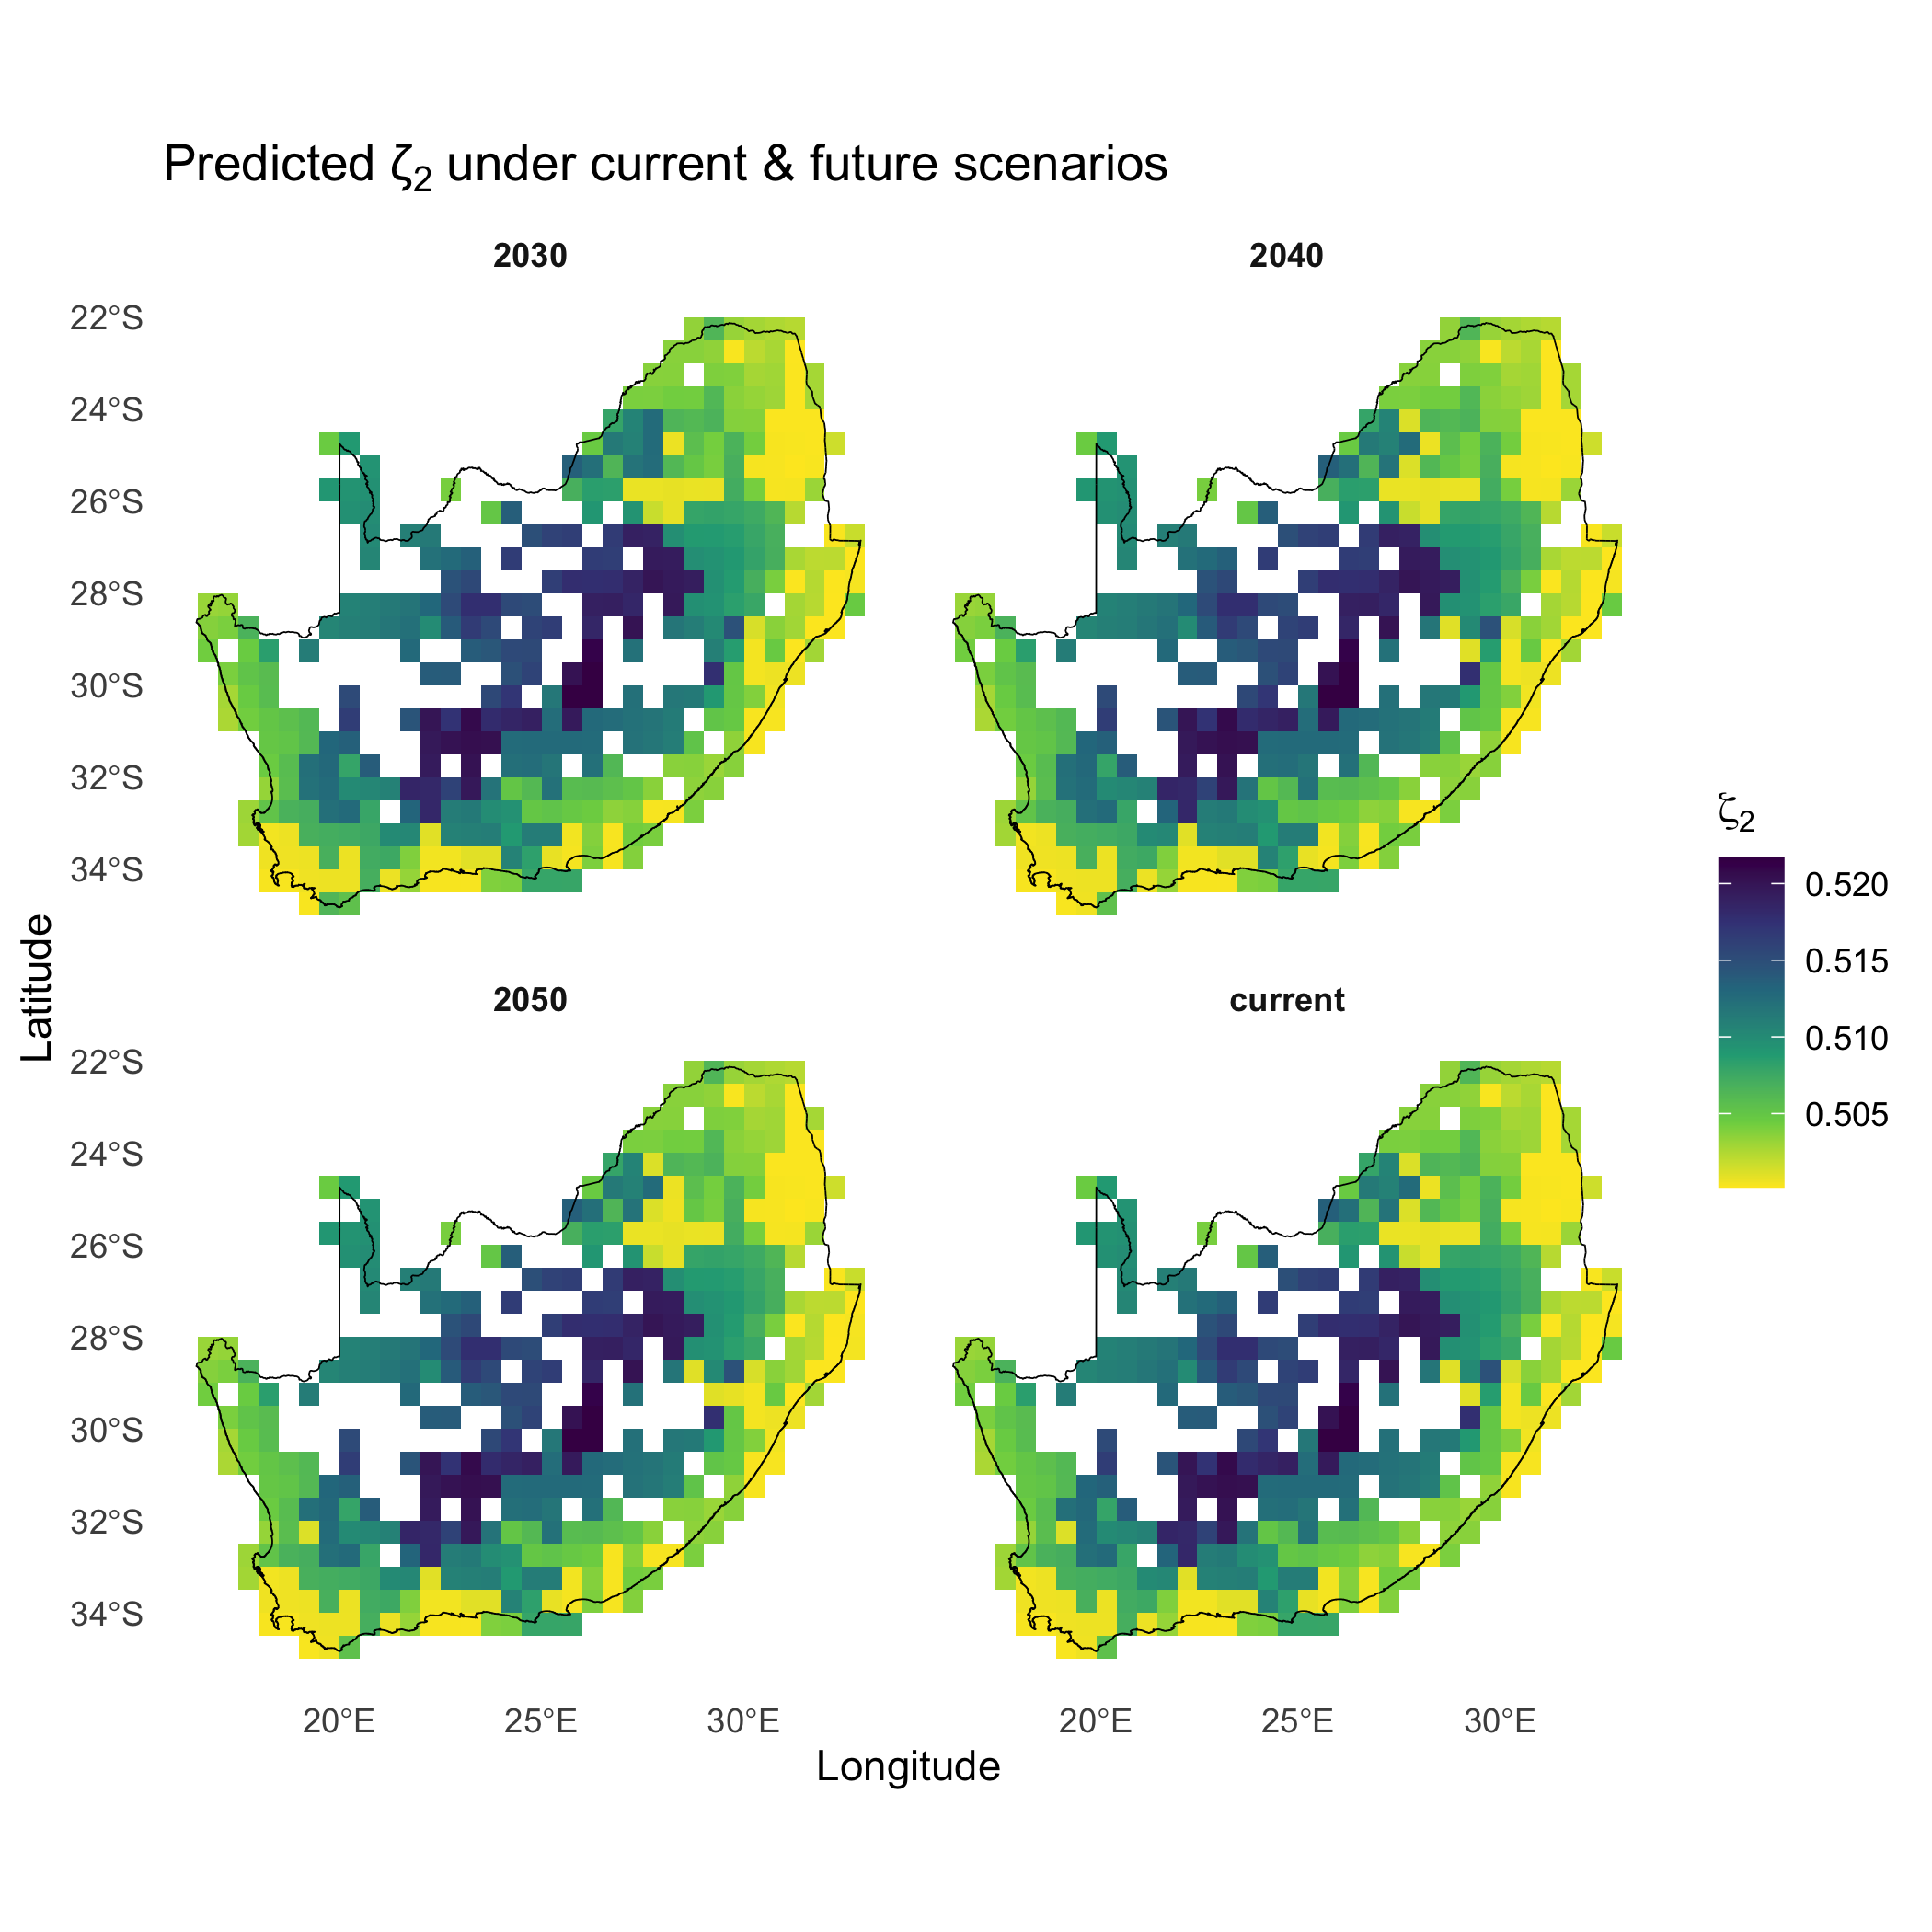
sessionInfo()#> R version 4.5.3 (2026-03-11)#> Platform: aarch64-apple-darwin20#> Running under: macOS Tahoe 26.6.2#>#> Matrix products: default#> BLAS: /System/Library/Frameworks/Accelerate.framework/Versions/A/Frameworks/vecLib.framework/Versions/A/libBLAS.dylib#> LAPACK: /Library/Frameworks/R.framework/Versions/4.5-arm64/Resources/lib/libRlapack.dylib; LAPACK version 3.12.1#>#> locale:#> [1] en_US.UTF-8/en_US.UTF-8/en_US.UTF-8/C/en_US.UTF-8/en_US.UTF-8#>#> time zone: Europe/Brussels#> tzcode source: internal#>#> attached base packages:#> [1] stats graphics grDevices utils datasets methods base#>#> other attached packages:#> [1] mclust_6.1.3 patchwork_1.3.2 viridis_0.6.5 viridisLite_0.4.3#> [5] ggplot2_4.0.3 zetadiv_1.3.0 scam_1.2-23 tidyterra_0.7.2#> [9] sf_1.1-3 zoo_1.9-1 tidyr_1.3.2 dplyr_1.2.1#> [13] data.table_1.18.6.1 geodata_0.6-9 terra_1.9-50 httr_1.4.9#> [17] dissmapr_0.2.0 here_1.0.2 purrr_1.2.2 yaml_2.3.12#>#> loaded via a namespace (and not attached):#> [1] RColorBrewer_1.1-3 wk_0.9.5 rstudioapi_0.17.1 magrittr_2.0.5#> [5] TH.data_1.1-3 estimability_2.0.0 corrplot_0.95 farver_2.1.2#> [9] rmarkdown_2.32 fields_18.0 fs_2.1.0 vctrs_0.7.3#> [13] memoise_2.0.1 htmltools_0.5.9 curl_8.1.0 s2_1.1.13#> [17] pROC_1.19.1 caret_7.0-1 parallelly_1.50.0 glm2_1.2.1#> [21] KernSmooth_2.23-26 desc_1.4.3 plyr_1.8.9 sandwich_3.1-1#> [25] emmeans_2.0.4 lubridate_1.9.5 cachem_1.1.0 lifecycle_1.0.5#> [29] iterators_1.0.14 pkgconfig_2.0.3 Matrix_1.7-5 R6_2.6.1#> [33] fastmap_1.2.0 future_1.82.0 digest_0.6.39 rematch2_2.1.2#> [37] rprojroot_2.1.1 RSQLite_3.53.3 vegan_2.7-6 labeling_0.4.3#> [41] b3doc_0.3.0.9000 nnls_1.6 timechange_0.4.0 mgcv_1.9-4#> [45] compiler_4.5.3 proxy_0.4-29 remotes_2.5.0.9000 withr_3.0.3#> [49] bit64_4.8.6 S7_0.2.2 crancache_0.0.0.9001 DBI_1.3.0#> [53] cranlike_1.0.3 pkgbuild_1.4.8 maps_3.4.4 R.utils_2.13.0#> [57] MASS_7.3-66 lava_1.10 rappdirs_0.3.4 classInt_0.4-11#> [61] permute_0.10-0 ModelMetrics_1.2.2.2 tools_4.5.3 units_1.0-1#> [65] otel_0.3.0 future.apply_1.21.0 nnet_7.3-20 R.oo_1.27.1#> [69] glue_1.8.1 debugme_1.2.0 callr_3.8.0 nlme_3.1-169#> [73] grid_4.5.3 rsconnect_1.5.0 cluster_2.1.8.2 reshape2_1.4.5#> [77] generics_0.1.4 recipes_1.4.0 gtable_0.3.6 R.methodsS3_1.8.2#> [81] class_7.3-23 utf8_1.2.6 ggrepel_0.9.8 foreach_1.5.2#> [85] pillar_1.11.1 stringr_1.6.0 spam_2.11-4 clValid_0.7#> [89] splines_4.5.3 lattice_0.22-9 survival_3.8-6 bit_4.6.0#> [93] tidyselect_1.2.1 pbapply_1.7-5 knitr_1.52 gridExtra_2.3.1#> [97] stats4_4.5.3 xfun_0.62 hardhat_1.4.3 factoextra_2.2.0#> [101] timeDate_4052.112 stringi_1.8.9 evaluate_1.0.5 codetools_0.2-20#> [105] NbClust_3.0.1 entropy_1.3.2 tibble_3.3.1 cli_3.6.6#> [109] rpart_4.1.24 xtable_1.8-8 processx_3.9.0 dichromat_2.0-0.1#> [113] Rcpp_1.1.2 globals_0.20.0 coda_0.19-4.1 parallel_4.5.3#> [117] gower_1.0.2 blob_1.3.0 parsedate_1.3.2 dotCall64_1.2#> [121] listenv_1.1.0 mvtnorm_1.4-2 ipred_0.9-16 scales_1.4.0#> [125] prodlim_2026.03.11 e1071_1.7-17 crayon_1.5.3 geosphere_1.6-8#> [129] rlang_1.3.0 multcomp_1.4-30