
Tutorial on computing invasion fitness
Install and load invasimapr and other core packages
Section titled “Install and load invasimapr and other core packages”Install from GitHub (recommended for development) or CRAN (if available) as before.
This appendix shows, step-by-step, how compute_invasion_fitness() and compute_establishment_probability() turn the standardised predictors you built earlier - abiotic suitability
Different invasion fitness options, linked back to the base formula
Section titled “Different invasion fitness options, linked back to the base formula”Compute different forms of invasion fitness
Section titled “Compute different forms of invasion fitness”compute_invasion_fitness() combines the trait-space geometry (where invaders sit relative to the resident cloud and convex hull) with environmental alignment and biotic resistance into a single linear index of invasion fitness:

where
:hourglass_flowing_sand: Inputs and outputs (at a glance): Inputs: matrices
:information_source: Why this matters: Having A-E in one place keeps analyses comparable and auditable. Start with a canonical baseline (A), then add realism: a global abiotic slope (B), trait-dependent scaling (C), site-varying slopes (D), or a signed saturation effect (E) when facilitation is plausible.
:warning: Practical checks and tips:
- Keep row/column names aligned across all matrices (sites as rownames; invaders as colnames).
- Use
calibrate_kappa = TRUEif you want residents centred near. - Do not include random slopes for
(it is site-only by construction). - Inspect distributions of
(or ); extreme values usually indicate scaling or model-fit issues. - Prefer signed
(Option E) only with a clear ecological rationale.
Each example below is a special case of the formula above that constrain which terms vary by site
Table S1: How each option instantiates the base form
| Option | ||||
|---|---|---|---|---|
| A | ||||
| B | optional calibration | |||
| C | optional calibration | |||
| D | optional calibration | |||
| E | optional calibration |
Broadcasting means: a vector by invader (e.g.,
Where the pieces come from
: from derive_sensitivities().: from site_varying_alpha()(random slopes on). : either broadcast / or a site-varying matrix if modeled. (calibration offset): optional shift so the mean resident is ~0 (when you calibrate).
Pick a level of complexity: Start with B (parsimonious, global
), move to C if traits clearly modulate abiotic response, use D when site random slopes matter, and switch to E only if you want to allow signed saturation effects.
Option A: Baseline (
Section titled “Option A: Baseline ( = 1, = 0)”A transparent first look: abiotic
:bulb: When to use: Rapid scans and communication; no extra scaling on
# Option Aalpha_i        = fit$sensitivities$alpha_ibeta_i         = fit$sensitivities$beta_i
outA = invasimapr::compute_invasion_fitness(  r_is_z, C_is_z, S_is_z,  option = "A",  alpha_i = alpha_i,    # named vector by invader  beta_i  = beta_i,     # named vector by invader  return_long = TRUE)str(outA,1)#> List of 7#>  $ lambda_is  : num [1:415, 1:10] -1.915 -5.174 -1.21 0.221 -1.276 ...#>   ..- attr(*, "dimnames")=List of 2#>  $ GI         : num [1:415, 1:10] 1 1 1 1 1 1 1 1 1 1 ...#>   ..- attr(*, "dimnames")=List of 2#>  $ AI         : num [1:415, 1:10] 0.982 0.982 0.982 0.982 0.982 ...#>   ..- attr(*, "dimnames")=List of 2#>  $ BI         : Named num [1:10] 0.0883 0.0695 0.0833 0.0925 0.045 ...#>   ..- attr(*, "names")= chr [1:10] "inv1" "inv2" "inv3" "inv4" ...#>  $ kappa      : num 0#>  $ option     : chr "Option A (gamma=1)"#>  $ lambda_long: tibble [4,150 × 7] (S3: tbl_df/tbl/data.frame)
:bar_chart: Map mean
# outA already created with compute_invasion_fitness(..., return_long = TRUE)
# 1) Site meanslambda_siteA = outA$lambda_long |>  dplyr::group_by(site) |>  dplyr::summarise(mean_lambda = mean(lambda, na.rm = TRUE), .groups = "drop") |>  dplyr::left_join(site_df, by = "site")  # needs columns: site, x, y
# 2) Continuous map (blue = low, red = high; 0-centered)p_lambdaA = ggplot2::ggplot(lambda_siteA, ggplot2::aes(x, y, fill = mean_lambda)) +  ggplot2::geom_tile() +  ggplot2::scale_fill_gradient2(name = "Mean \u03BB", midpoint = 0) + # or `expression("Mean " * lambda)`  ggplot2::labs(    title = "Mean invasion fitness (\u03BB) by site - Option A", # or `expression("Mean invasion fitness (" * lambda * ") by site — Option A")`    x = "Longitude", y = "Latitude"  ) +  ggplot2::theme_minimal()if (exists("rsa")) p_lambdaA = p_lambdaA +  ggplot2::geom_sf(data = rsa, inherit.aes = FALSE, fill = NA, color = "black", size = 0.3)print(p_lambdaA)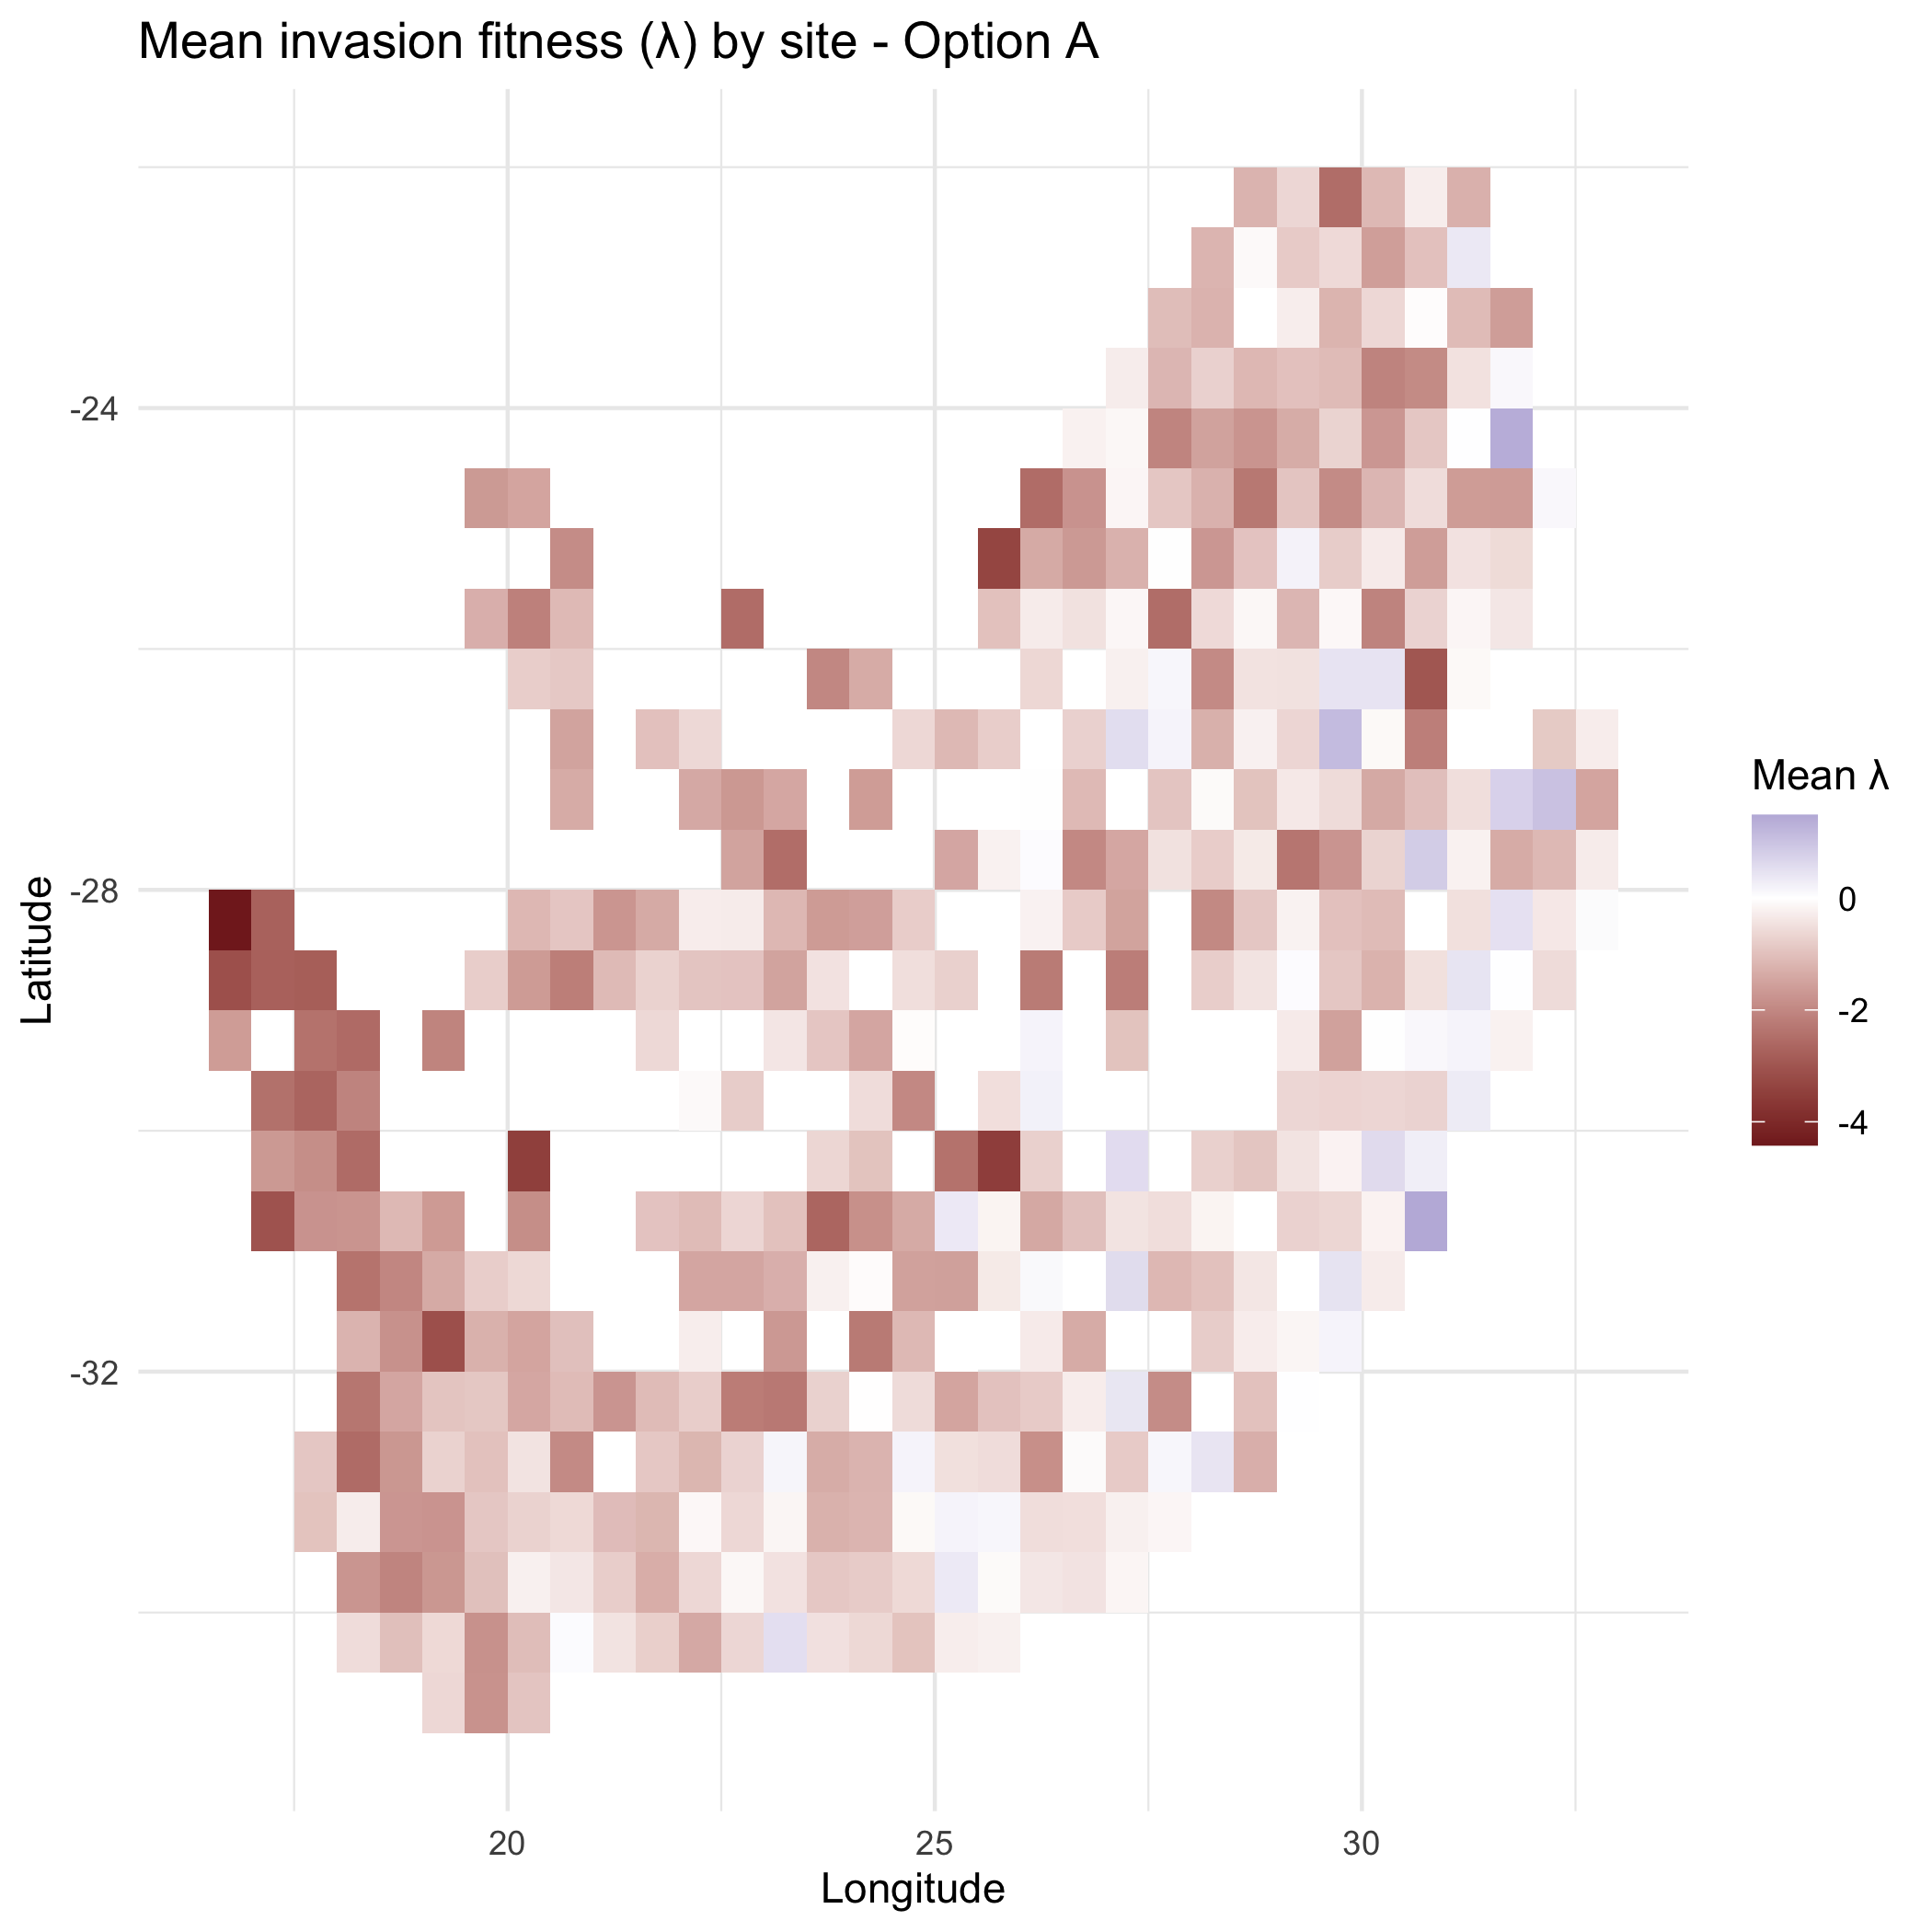
# 3) Optional: discrete “risk bands” (quintiles)lambda_siteA$band = cut(  lambda_siteA$mean_lambda,  breaks = stats::quantile(lambda_siteA$mean_lambda, probs = seq(0, 1, 0.2), na.rm = TRUE),  include.lowest = TRUE,  labels = c("very-low","low","medium","high","very-high"))
p_lambdaA_bands = ggplot2::ggplot(lambda_siteA, ggplot2::aes(x, y, fill = band)) +  ggplot2::geom_tile() +  ggplot2::scale_fill_brewer(palette = "RdYlBu", direction = 1, name = "Site invasibility") +  ggplot2::labs(title = "Site invasibility bands (quintiles) - Option A",                x = "Longitude", y = "Latitude") +  ggplot2::theme_minimal()if (exists("rsa")) p_lambdaA_bands = p_lambdaA_bands +  ggplot2::geom_sf(data = rsa, inherit.aes = FALSE, fill = NA, color = "black", size = 0.3)print(p_lambdaA_bands)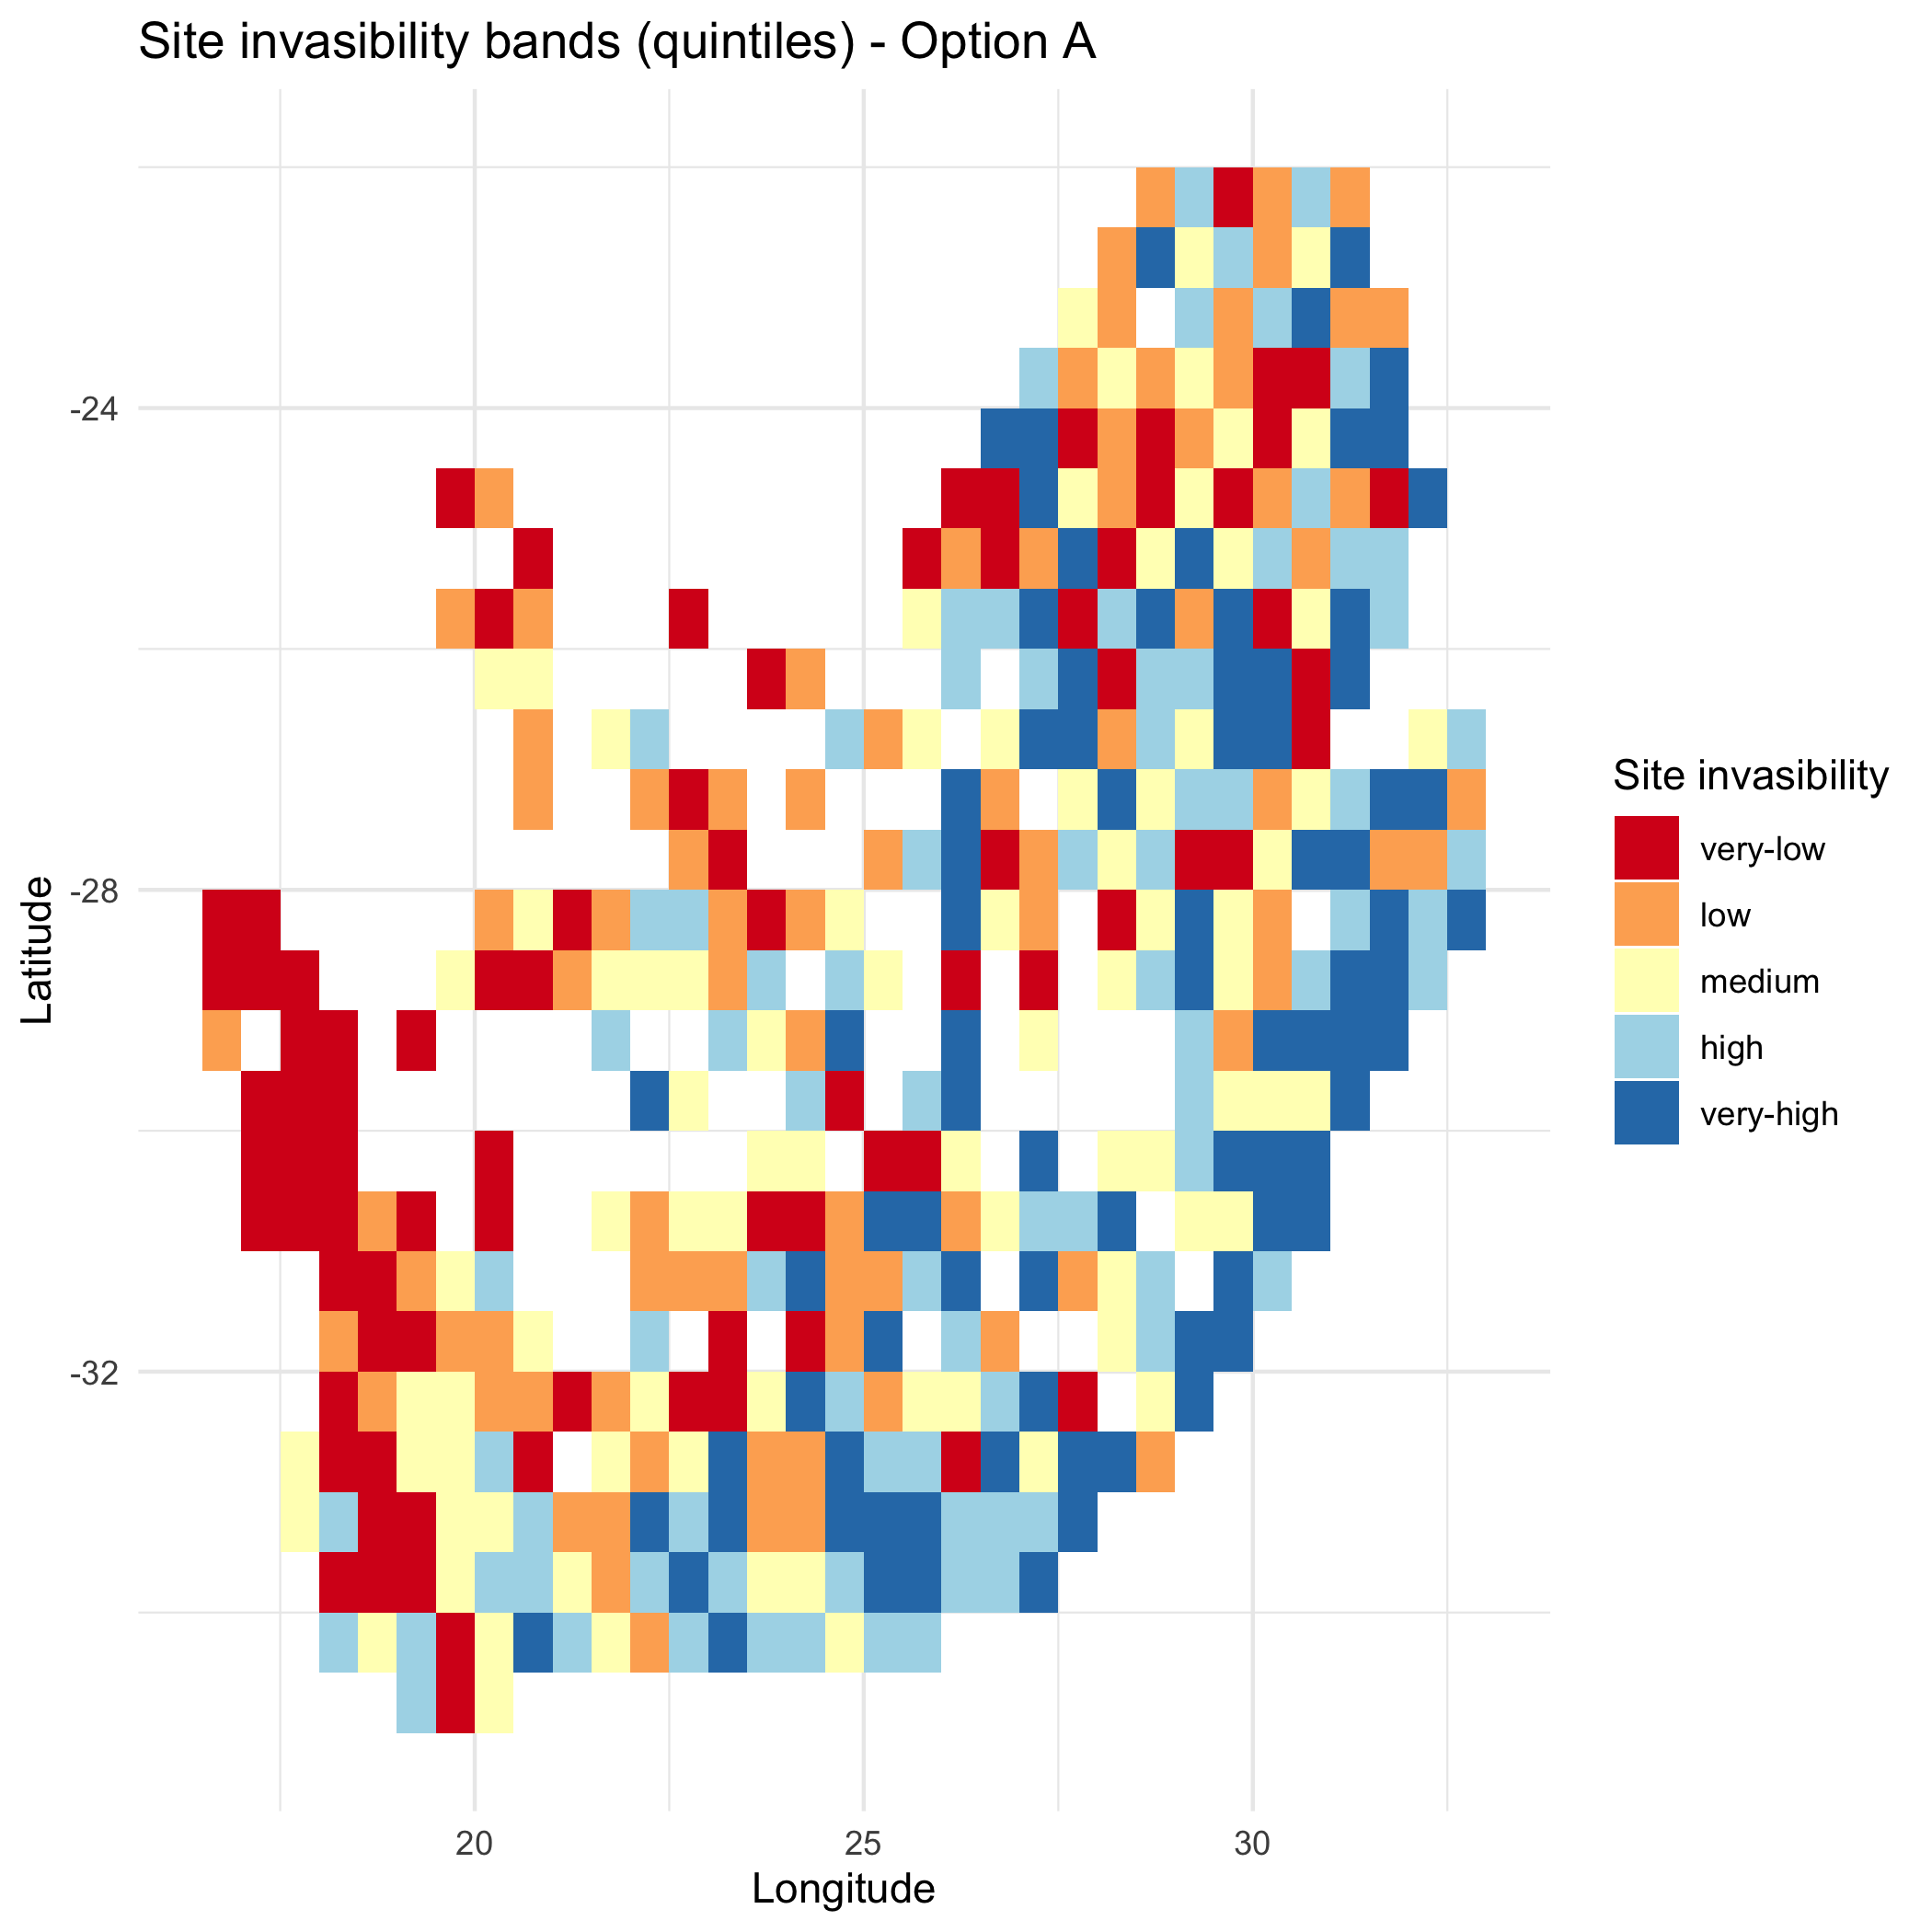
:chart_with_upwards_trend: Figure 1: Baseline spatial pattern of mean invasion fitness
with zero-centred colour scaling and optional boundary overlay. Positive regions (red) indicate conditions favouring establishment; negative regions (blue) reflect net biotic penalties or abiotic misalignment. A discrete quintile variant summarises relative invasibility for communication.
Option B: Parsimonious abiotic scaling (
Section titled “Option B: Parsimonious abiotic scaling ( = )”A single slope
:bulb: When to use: Auxiliary fits suggest a strong global slope on
outB = invasimapr::compute_invasion_fitness( r_is_z, C_is_z, S_is_z, option = "B", alpha_i = alpha_i, beta_i = beta_i, theta0 = 0.8, # example value return_long = TRUE)str(outB,1)#> List of 7#> $ lambda_is : num [1:415, 1:10] -1.7504 -4.7215 -1.258 -0.0204 -1.212 ...#> ..- attr(*, "dimnames")=List of 2#> $ GI : num [1:415, 1:10] 0.8 0.8 0.8 0.8 0.8 0.8 0.8 0.8 0.8 0.8 ...#> ..- attr(*, "dimnames")=List of 2#> $ AI : num [1:415, 1:10] 0.982 0.982 0.982 0.982 0.982 ...#> ..- attr(*, "dimnames")=List of 2#> $ BI : Named num [1:10] 0.0883 0.0695 0.0833 0.0925 0.045 ...#> ..- attr(*, "names")= chr [1:10] "inv1" "inv2" "inv3" "inv4" ...#> $ kappa : num 0#> $ option : chr "Option B (gamma=theta_0)"#> $ lambda_long: tibble [4,150 × 7] (S3: tbl_df/tbl/data.frame):bar_chart: Computes site-mean invasion fitness*
# 1) Site means for Option Blambda_siteB = outB$lambda_long |>  dplyr::group_by(site) |>  dplyr::summarise(mean_lambda = mean(lambda, na.rm = TRUE), .groups = "drop") |>  dplyr::left_join(site_df, by = "site")
# 2) Continuous map (0-centered)p_lambdaB = ggplot2::ggplot(lambda_siteB, ggplot2::aes(x, y, fill = mean_lambda)) +  ggplot2::geom_tile() +  ggplot2::scale_fill_gradient2(name = "Mean \u03BB", midpoint = 0) +  ggplot2::labs(title = "Mean invasion fitness (\u03BB) by site — Option B",                x = "Longitude", y = "Latitude") +  ggplot2::theme_minimal()if (exists("rsa")) p_lambdaB = p_lambdaB +  ggplot2::geom_sf(data = rsa, inherit.aes = FALSE, fill = NA, color = "black", size = 0.3)print(p_lambdaB)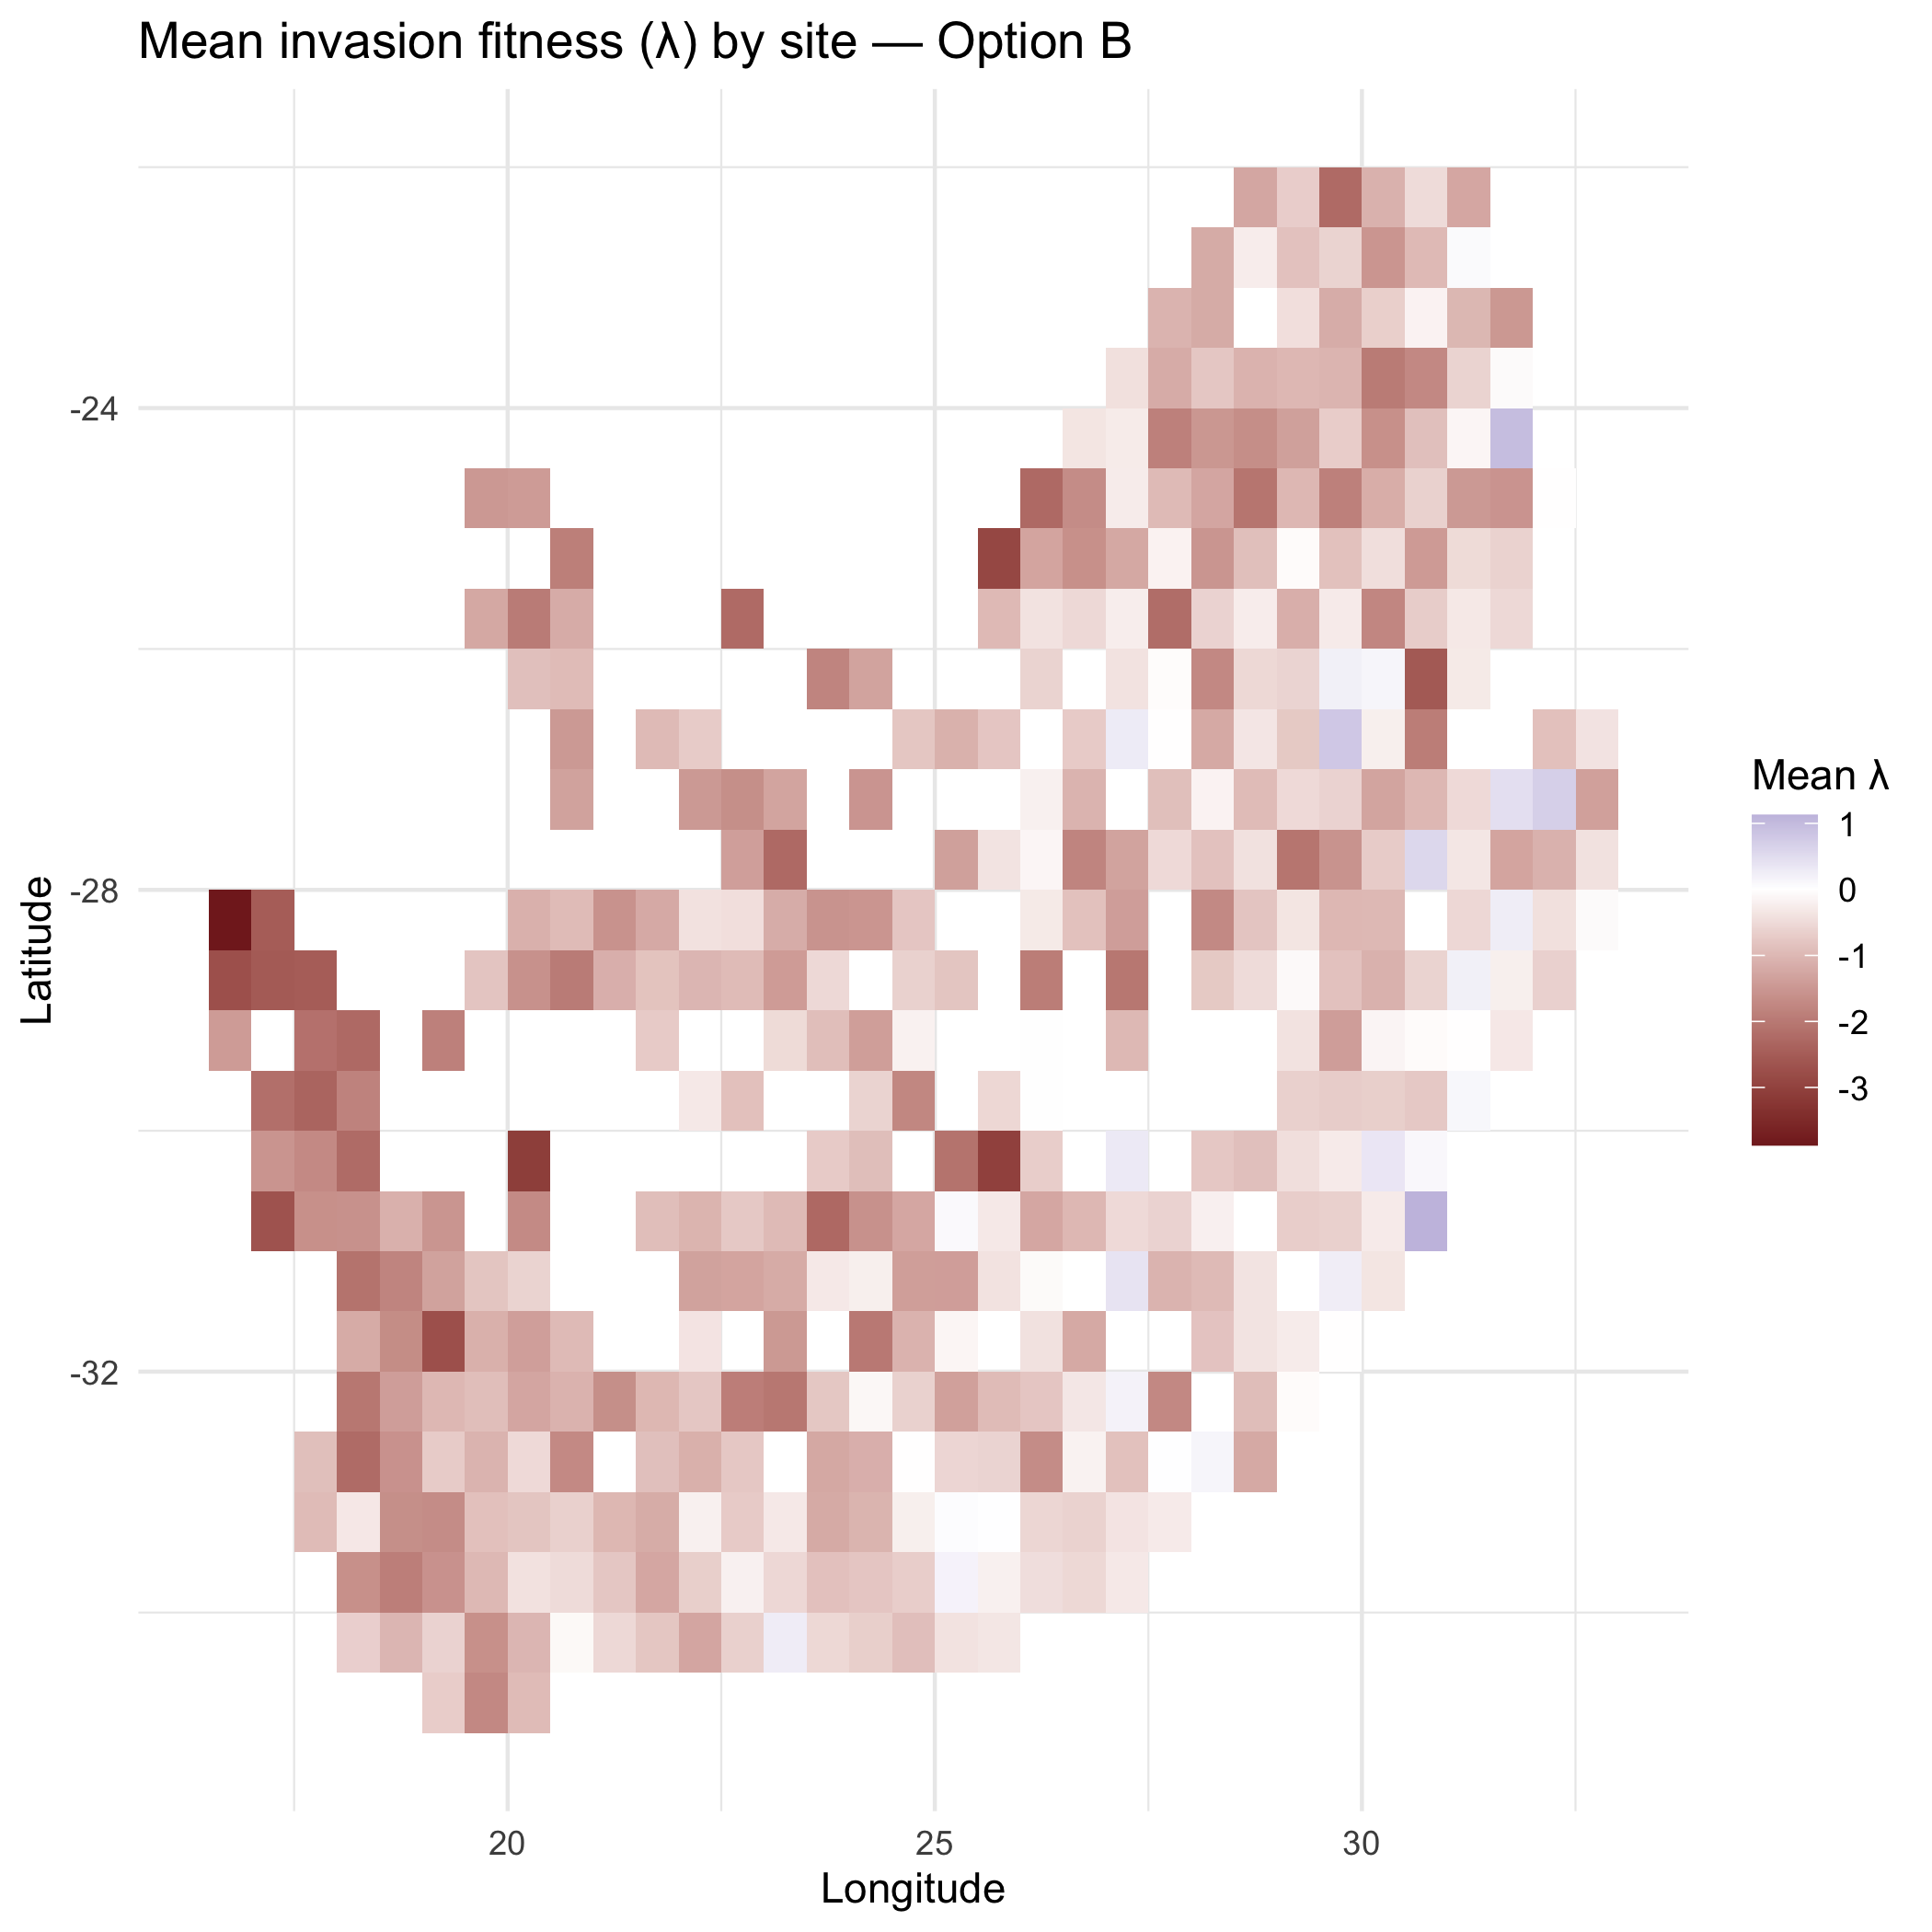
# 3) Optional: discrete “risk bands” (quintiles) for Option Blambda_siteB$band = cut(  lambda_siteB$mean_lambda,  breaks = stats::quantile(lambda_siteB$mean_lambda, probs = seq(0, 1, 0.2), na.rm = TRUE),  include.lowest = TRUE,  labels = c("very-low", "low", "medium", "high", "very-high"))
p_lambdaB_bands = ggplot2::ggplot(lambda_siteB, ggplot2::aes(x, y, fill = band)) +  ggplot2::geom_tile() +  ggplot2::scale_fill_brewer(palette = "RdYlBu", direction = 1, name = "Site invasibility") +  ggplot2::labs(title = "Site invasibility bands (quintiles) — Option B",                x = "Longitude", y = "Latitude") +  ggplot2::theme_minimal()if (exists("rsa")) p_lambdaB_bands = p_lambdaB_bands +  ggplot2::geom_sf(data = rsa, inherit.aes = FALSE, fill = NA, color = "black", size = 0.3)print(p_lambdaB_bands)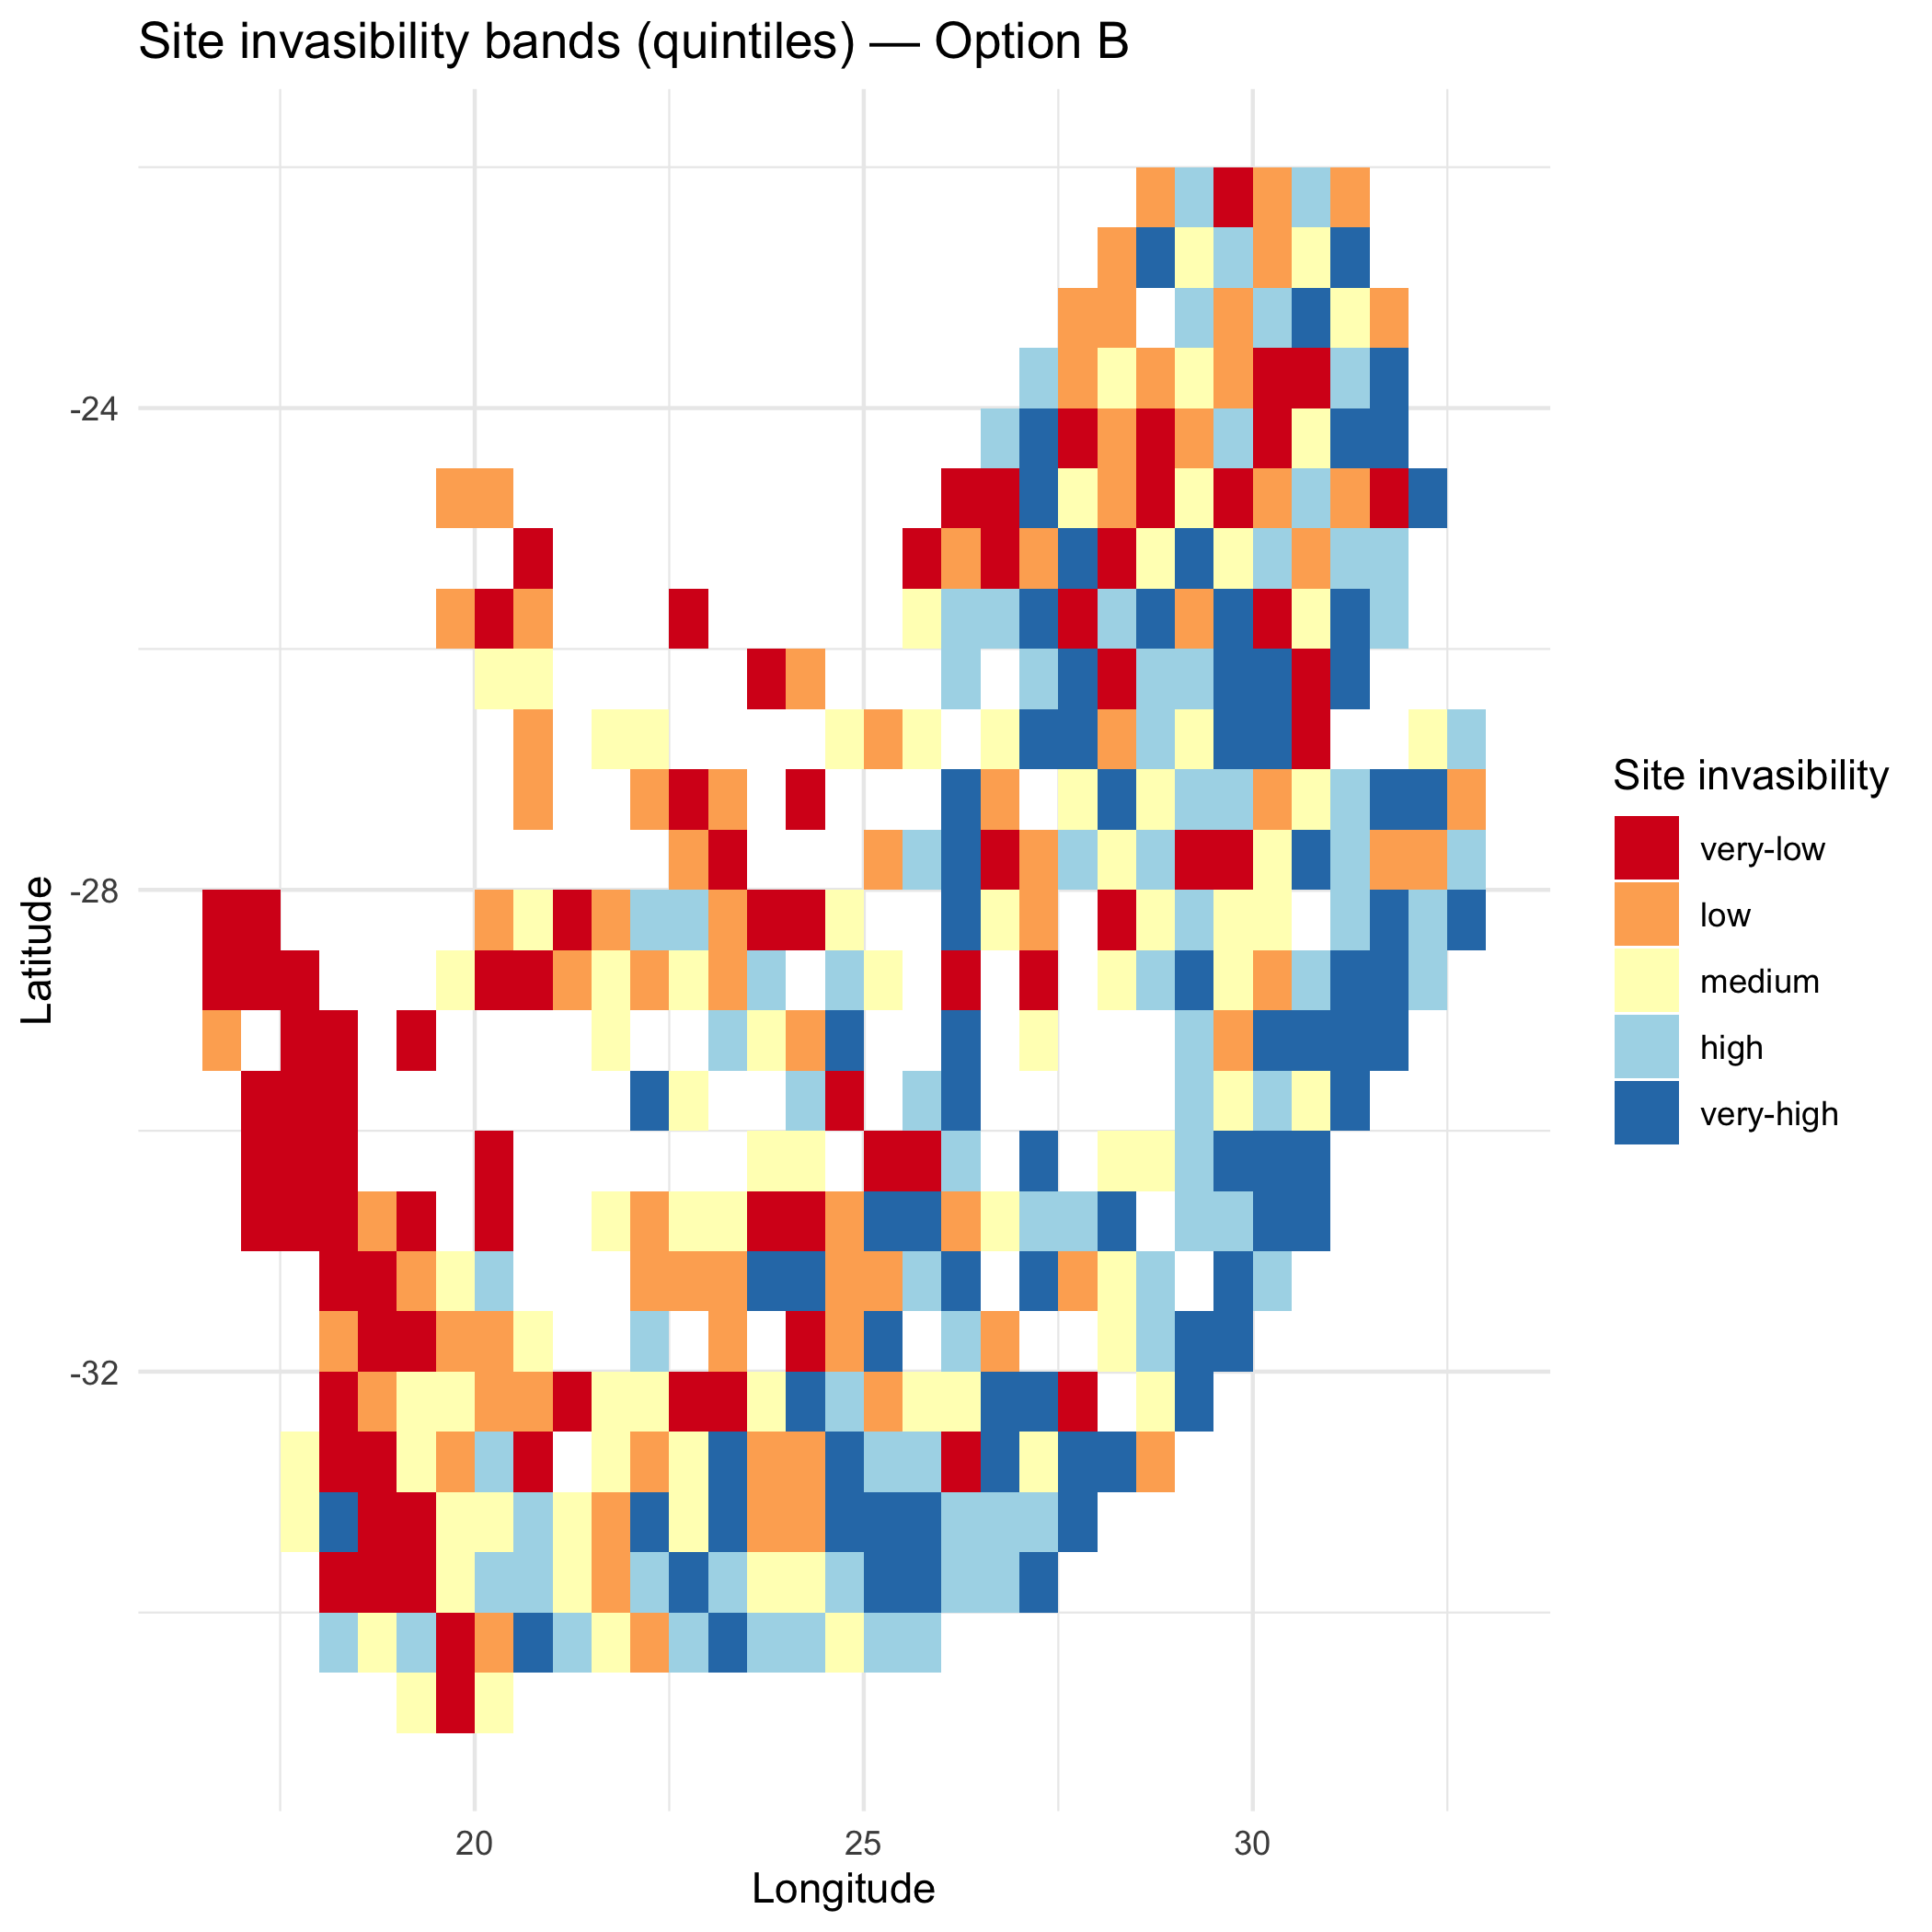
:chart_with_upwards_trend: Figure 2: Spatial pattern of mean invasion fitness under a single abiotic rescaling
. Global down-/up-weighting of compresses or amplifies contrasts relative to Option A, while biotic penalties remain unchanged.
Option C: Trait-varying abiotic scaling (
Section titled “Option C: Trait-varying abiotic scaling ( = )”Different invader strategies convert abiotic alignment to fitness at different rates (learned from the auxiliary GLMM in trait space).
:bulb: When to use: There is clear trait × r interaction; likelihood-ratio tests favour trait-varying slopes.
theta_i = fit$sensitivities$theta_ioutC = invasimapr::compute_invasion_fitness( r_is_z, C_is_z, S_is_z, option = "C", alpha_i = alpha_i, beta_i = beta_i, theta_i = theta_i, # named vector by invader return_long = TRUE)str(outC, 1)#> List of 7#> $ lambda_is : num [1:415, 1:10] -1.283 -3.433 -1.394 -0.709 -1.031 ...#> ..- attr(*, "dimnames")=List of 2#> $ GI : num [1:415, 1:10] 0.231 0.231 0.231 0.231 0.231 ...#> ..- attr(*, "dimnames")=List of 2#> $ AI : num [1:415, 1:10] 0.982 0.982 0.982 0.982 0.982 ...#> ..- attr(*, "dimnames")=List of 2#> $ BI : Named num [1:10] 0.0883 0.0695 0.0833 0.0925 0.045 ...#> ..- attr(*, "names")= chr [1:10] "inv1" "inv2" "inv3" "inv4" ...#> $ kappa : num 0#> $ option : chr "Option C (gamma=theta_i)"#> $ lambda_long: tibble [4,150 × 7] (S3: tbl_df/tbl/data.frame)Optional calibration. Align invader and resident scales using resident moments and trait-plane slopes.
Q_res = fit$traits$Q_resresC = invasimapr::compute_invasion_fitness( r_is_z, C_is_z, S_is_z, option = "C", alpha_i = alpha_i, beta_i = beta_i, theta_i = theta_i, calibrate_kappa = TRUE, r_js_z = r_js_z, C_js_z = C_js_z, S_js_z = S_js_z, Q_res = Q_res, a0 = fit$sensitivities$a0, a1 = fit$sensitivities$a1, a2 = fit$sensitivities$a2, b0 = fit$sensitivities$b0, b1 = fit$sensitivities$b1, b2 = fit$sensitivities$b2, return_long = TRUE)str(resC, 1)#> List of 7#> $ lambda_is : num [1:415, 1:10] -1.28 -3.43 -1.39 -0.71 -1.03 ...#> ..- attr(*, "dimnames")=List of 2#> $ GI : num [1:415, 1:10] 0.231 0.231 0.231 0.231 0.231 ...#> ..- attr(*, "dimnames")=List of 2#> $ AI : num [1:415, 1:10] 0.982 0.982 0.982 0.982 0.982 ...#> ..- attr(*, "dimnames")=List of 2#> $ BI : Named num [1:10] 0.0883 0.0695 0.0833 0.0925 0.045 ...#> ..- attr(*, "names")= chr [1:10] "inv1" "inv2" "inv3" "inv4" ...#> $ kappa : num -0.000987#> $ option : chr "Option C (gamma=theta_i)"#> $ lambda_long: tibble [4,150 × 7] (S3: tbl_df/tbl/data.frame):bar_chart: Aggregates
# Site means (Option C)lambda_siteC = resC$lambda_long |>  dplyr::group_by(site) |>  dplyr::summarise(mean_lambda = mean(lambda, na.rm = TRUE), .groups = "drop") |>  dplyr::left_join(site_df, by = "site")
# Robust quintile bands (handles ties / constant vectors)q = stats::quantile(lambda_siteC$mean_lambda, probs = seq(0, 1, 0.2), na.rm = TRUE)if (length(unique(q)) < 6L) {  # fallback if quantiles are not strictly increasing  q = seq(min(lambda_siteC$mean_lambda, na.rm = TRUE),           max(lambda_siteC$mean_lambda, na.rm = TRUE),           length.out = 6L)}
lambda_siteC$band = cut(  lambda_siteC$mean_lambda,  breaks = q, include.lowest = TRUE,  labels = c("very-low", "low", "medium", "high", "very-high"))
# Map: discrete risk bands (Option C)p_lambdaC_bands = ggplot2::ggplot(lambda_siteC, ggplot2::aes(x = x, y = y, fill = band)) +  ggplot2::geom_tile() +  ggplot2::scale_fill_brewer(palette = "RdYlBu", direction = 1, name = "Site invasibility") +  ggplot2::labs(title = "Site invasibility bands (quintiles) — Option C",                x = "Longitude", y = "Latitude") +  ggplot2::theme_minimal(base_size = 12) +  ggplot2::theme(panel.grid = ggplot2::element_blank())
if (exists("rsa")) {  p_lambdaC_bands = p_lambdaC_bands +    ggplot2::geom_sf(data = rsa, inherit.aes = FALSE, fill = NA, color = "black", size = 0.3)}
print(p_lambdaC_bands)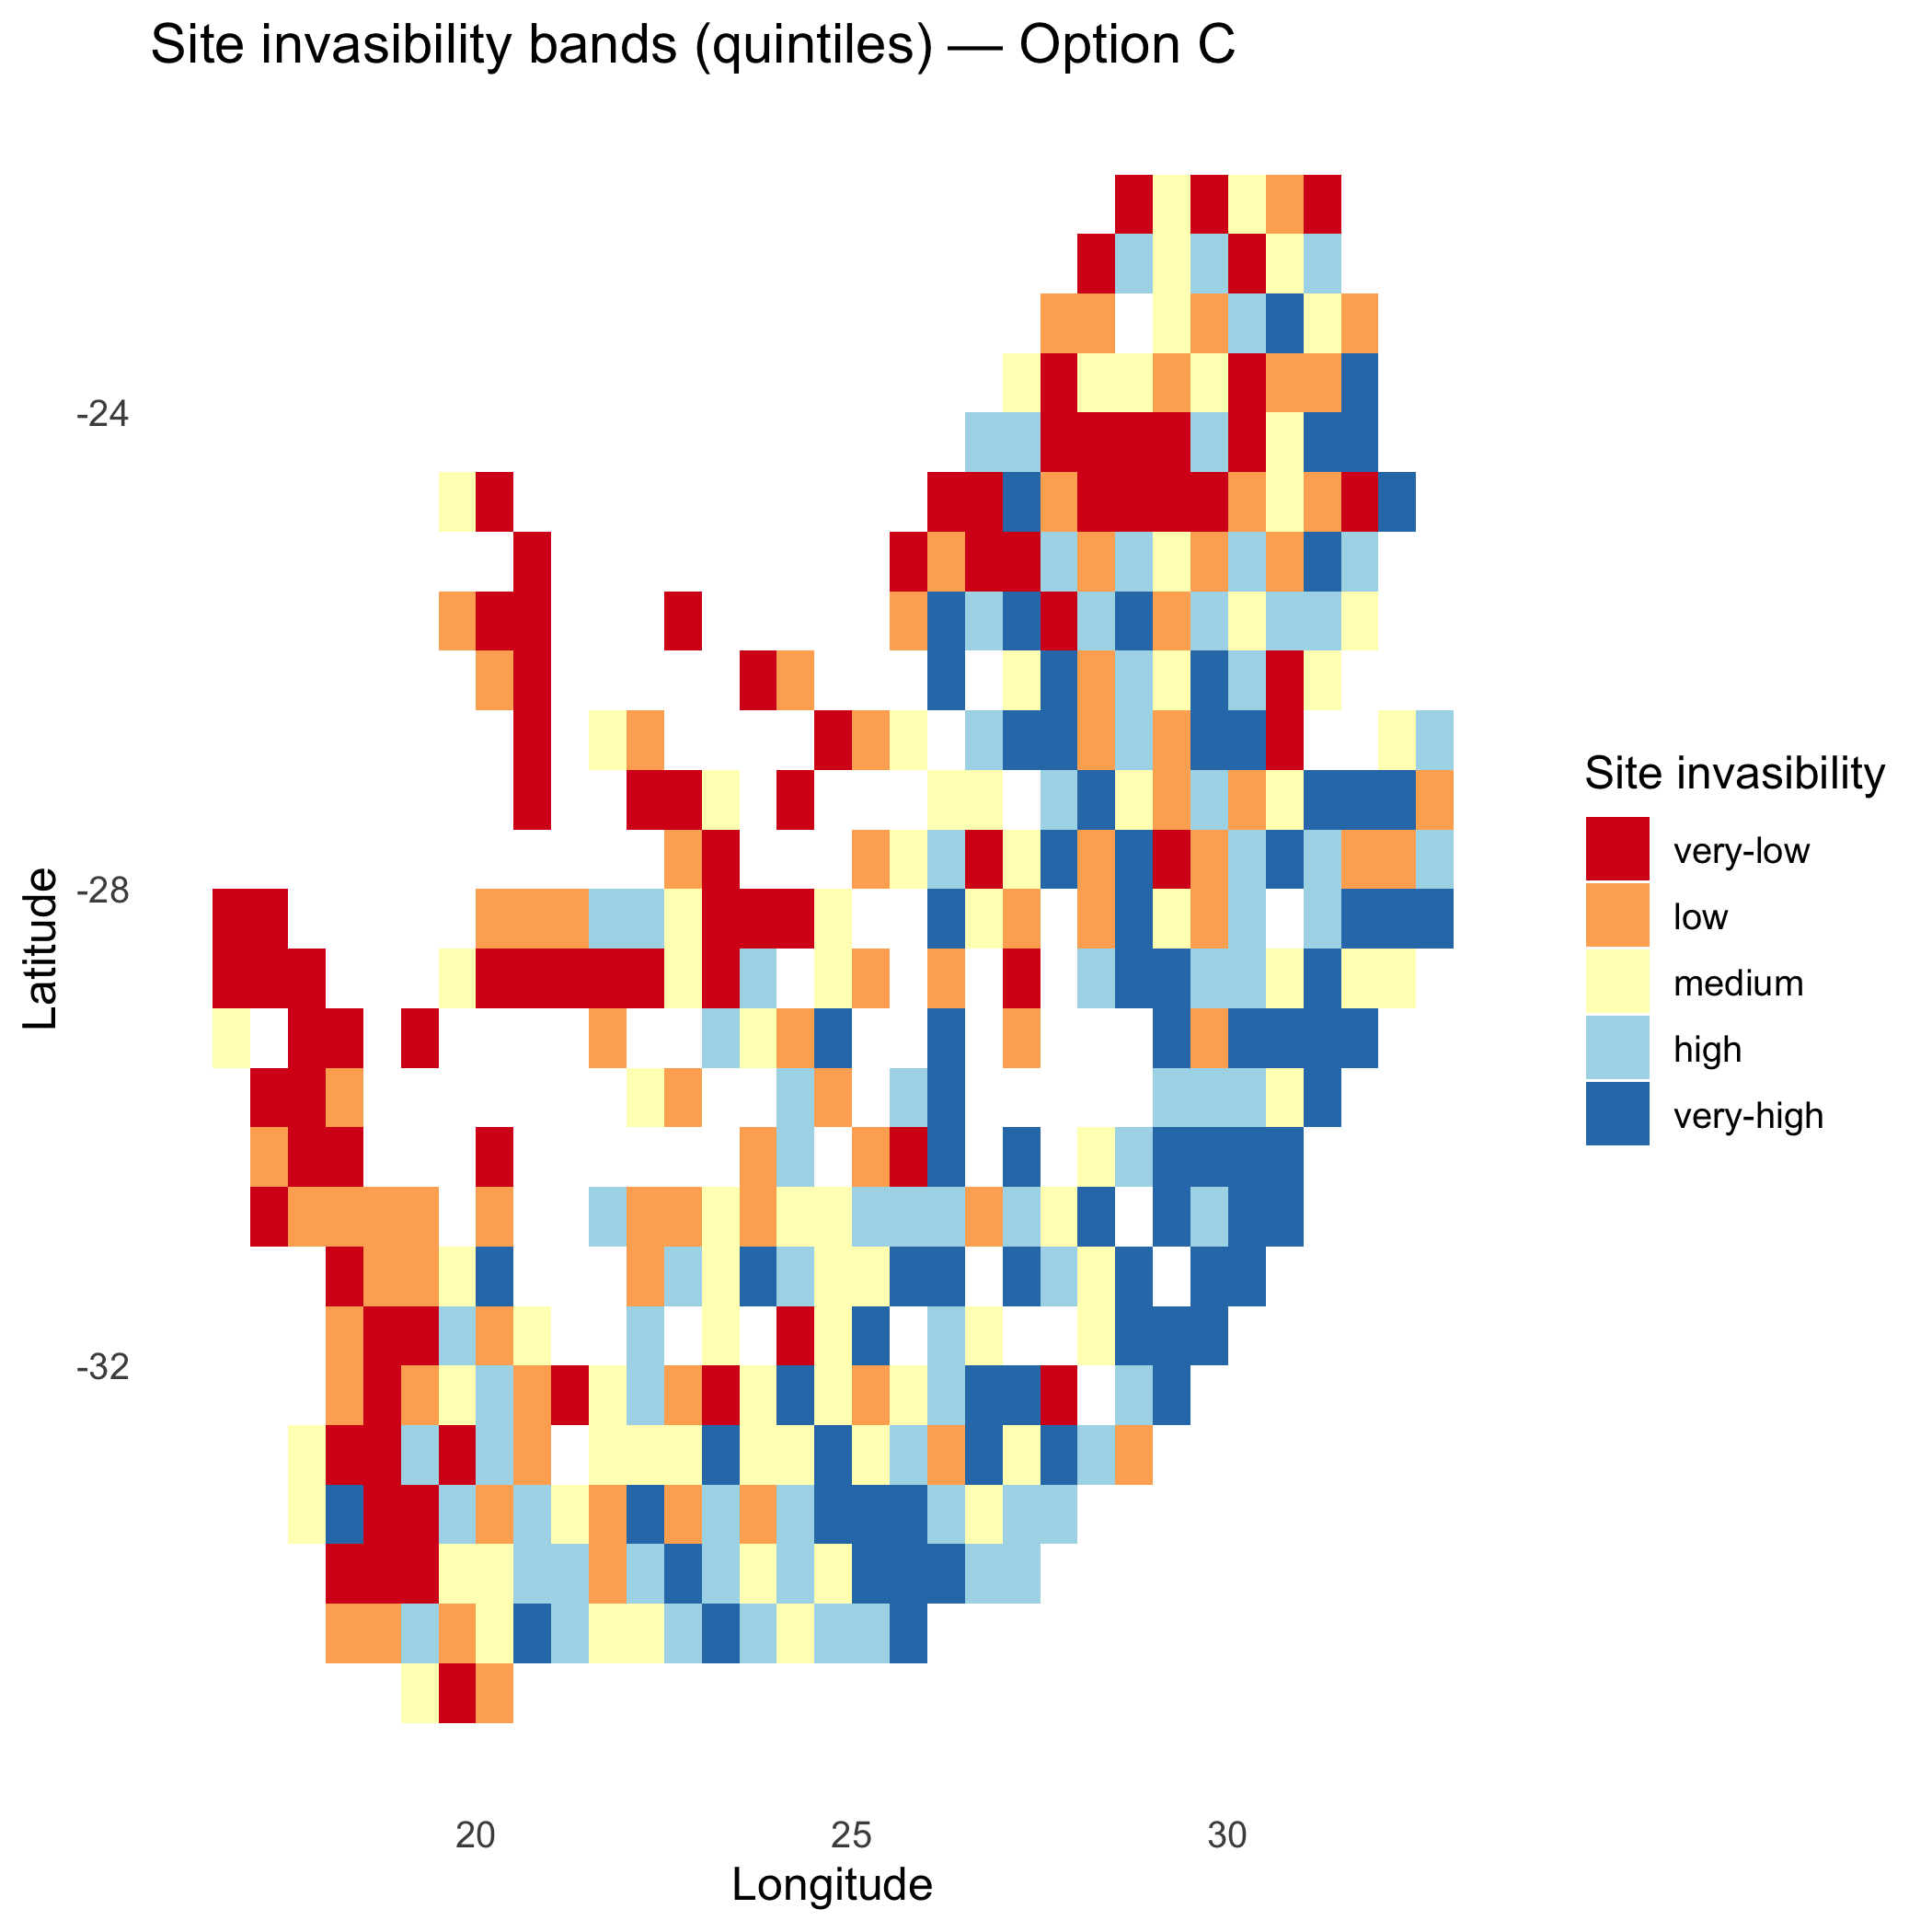
:chart_with_upwards_trend: Figure 3: Site-level invasibility bands with trait-varying abiotic slopes
. Heterogeneity reflects trait × abiotic interactions learned from the auxiliary model; warm bands denote sites where particular strategies convert abiotic alignment into fitness more efficiently.
Option D: Site-varying abiotic and crowding (
Section titled “Option D: Site-varying abiotic and crowding (, )”Allow local heterogeneity via site random slopes: some places amplify abiotic gains (
:bulb: When to use: Auxiliary model includes (0 + r_z || site) and/or (0 + C_z || site) with non-trivial variance.
outD = invasimapr::compute_invasion_fitness( r_is_z, C_is_z, S_is_z, option = "D", Gamma_is = Gamma_is, # site × invader matrix alpha_is = alpha_is, # site × invader matrix, ≥ 0 beta_i = beta_i, return_long = TRUE)str(outD, 1)#> List of 7#> $ lambda_is : num [1:415, 1:10] -1.283 -3.433 -1.394 -0.709 -1.031 ...#> ..- attr(*, "dimnames")=List of 2#> $ GI : num [1:415, 1:10] 0.231 0.231 0.231 0.231 0.231 ...#> ..- attr(*, "dimnames")=List of 2#> $ AI : num [1:415, 1:10] 0.982 0.982 0.982 0.982 0.982 ...#> ..- attr(*, "dimnames")=List of 2#> $ BI : Named num [1:10] 0.0883 0.0695 0.0833 0.0925 0.045 ...#> ..- attr(*, "names")= chr [1:10] "inv1" "inv2" "inv3" "inv4" ...#> $ kappa : num 0#> $ option : chr "Option D (Gamma_is, alpha_is)"#> $ lambda_long: tibble [4,150 × 7] (S3: tbl_df/tbl/data.frame):bar_chart: Summarises
# Site means (Option D)lambda_siteD = outD$lambda_long |>  dplyr::group_by(site) |>  dplyr::summarise(mean_lambda = mean(lambda, na.rm = TRUE), .groups = "drop") |>  dplyr::left_join(site_df, by = "site")
# Robust quintile bands (handles ties / constant vectors)q = stats::quantile(lambda_siteD$mean_lambda, probs = seq(0, 1, 0.2), na.rm = TRUE)if (length(unique(q)) < 6L) {  # fallback if quantiles are not strictly increasing  q = seq(min(lambda_siteD$mean_lambda, na.rm = TRUE),           max(lambda_siteD$mean_lambda, na.rm = TRUE),           length.out = 6L)}
lambda_siteD$band = cut(  lambda_siteD$mean_lambda,  breaks = q, include.lowest = TRUE,  labels = c("very-low", "low", "medium", "high", "very-high"))
# Map: discrete risk bands (Option D)p_lambdaD_bands = ggplot2::ggplot(lambda_siteD, ggplot2::aes(x = x, y = y, fill = band)) +  ggplot2::geom_tile() +  ggplot2::scale_fill_brewer(palette = "RdYlBu", direction = 1, name = "Site invasibility") +  ggplot2::labs(title = "Site invasibility bands (quintiles) — Option D",                x = "Longitude", y = "Latitude") +  ggplot2::theme_minimal(base_size = 12) +  ggplot2::theme(panel.grid = ggplot2::element_blank())
if (exists("rsa")) {  p_lambdaD_bands = p_lambdaD_bands +    ggplot2::geom_sf(data = rsa, inherit.aes = FALSE, fill = NA, color = "black", size = 0.3)}
print(p_lambdaD_bands)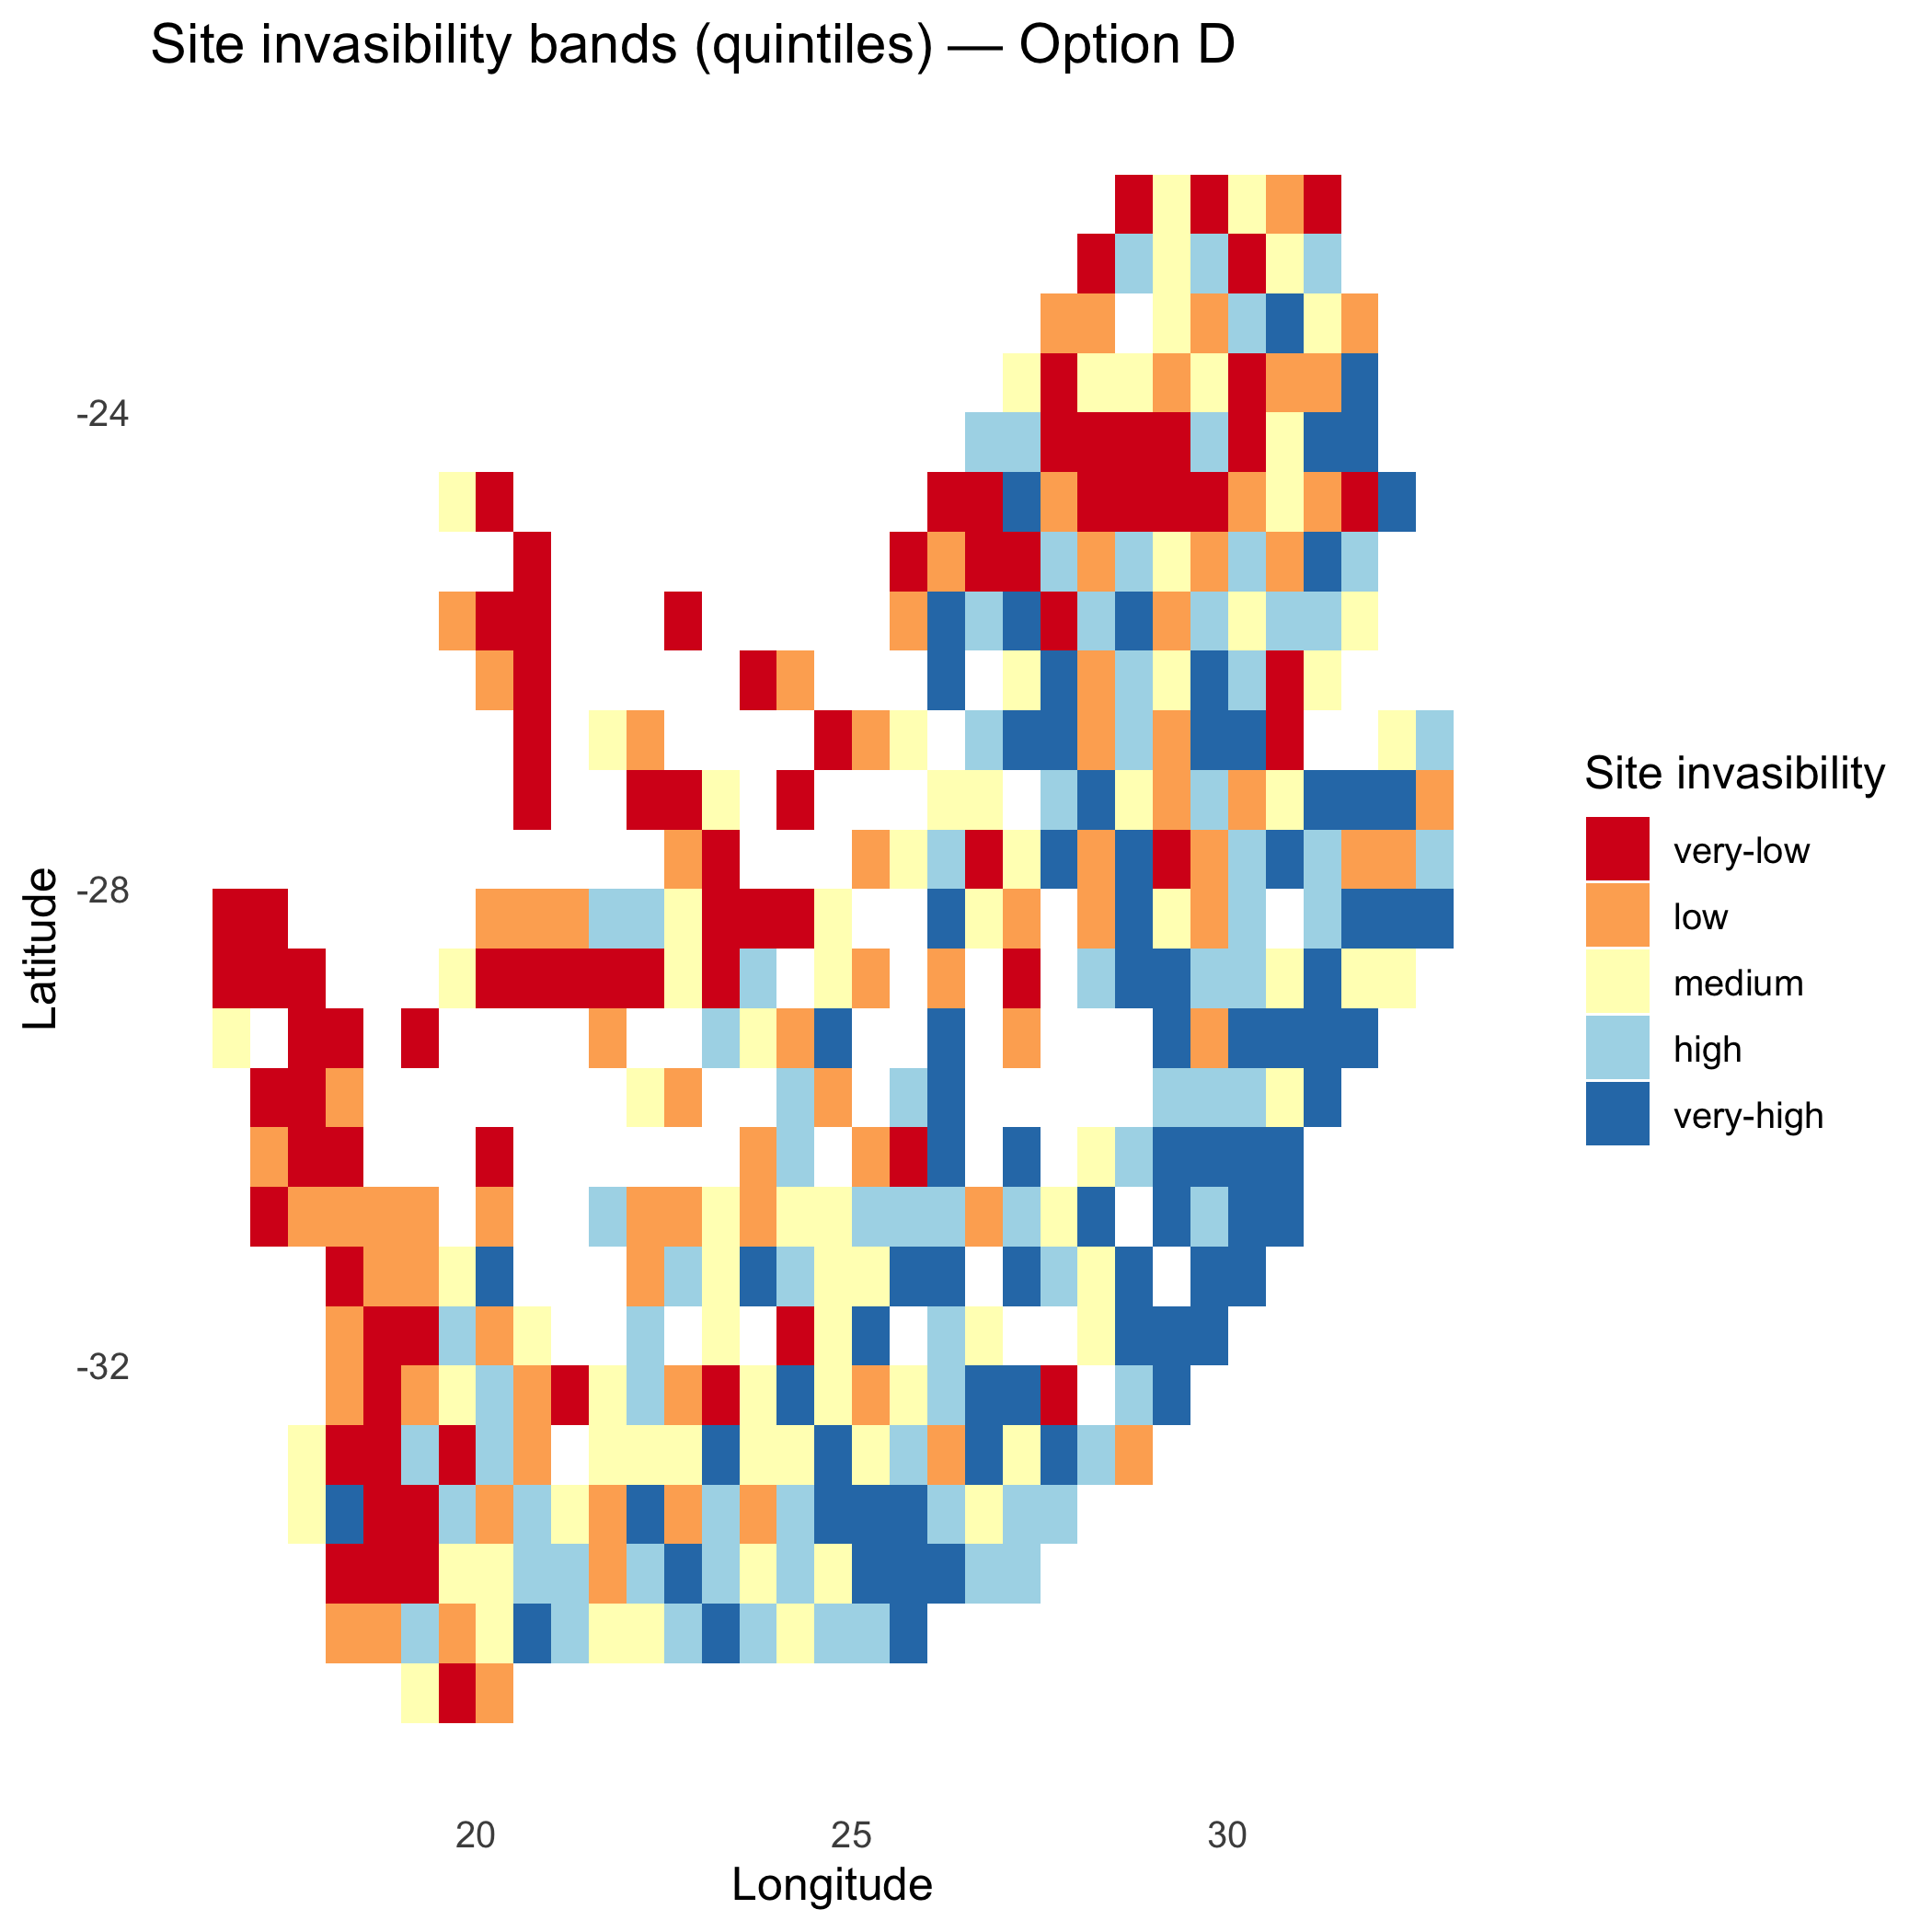
:chart_with_upwards_trend: Figure 4: Invasibility bands under site-varying
and . Spatial structure highlights locations with amplified abiotic gains (high ) or stronger crowding (large ), indicating where establishment pressure is locally enhanced or suppressed
:bulb: Interpretation: Heatmaps of
Option E: Signed saturation effect (
Section titled “Option E: Signed saturation effect ( may be ±)”Let
:bulb: When to use: There is a defensible ecological case for facilitation; signed slopes improve fit/realism.
outE = invasimapr::compute_invasion_fitness( r_is_z, C_is_z, S_is_z, option = "E", alpha_i = alpha_i, beta_signed_i = beta_signed_i, # named vector, can be < 0 or > 0 theta0 = 1, return_long = TRUE)str(outE, 1)#> List of 7#> $ lambda_is : num [1:415, 1:10] -1.884 -5.37 -0.962 0.532 -0.643 ...#> ..- attr(*, "dimnames")=List of 2#> $ GI : num [1:415, 1:10] 1 1 1 1 1 1 1 1 1 1 ...#> ..- attr(*, "dimnames")=List of 2#> $ AI : num [1:415, 1:10] 0.982 0.982 0.982 0.982 0.982 ...#> ..- attr(*, "dimnames")=List of 2#> $ BI : Named num [1:10] -0.0883 -0.0695 -0.0833 -0.0925 -0.045 ...#> ..- attr(*, "names")= chr [1:10] "inv1" "inv2" "inv3" "inv4" ...#> $ kappa : num 0#> $ option : chr "Option E (signed S)"#> $ lambda_long: tibble [4,150 × 7] (S3: tbl_df/tbl/data.frame):bar_chart: Computes site means and quintile bands when saturation
# Site means (Option E)lambda_siteE = outE$lambda_long |>  dplyr::group_by(site) |>  dplyr::summarise(mean_lambda = mean(lambda, na.rm = TRUE), .groups = "drop") |>  dplyr::left_join(site_df, by = "site")
# Robust quintile bands (handles ties / constant vectors)q = stats::quantile(lambda_siteE$mean_lambda, probs = seq(0, 1, 0.2), na.rm = TRUE)if (length(unique(q)) < 6L) {  # fallback if quantiles are not strictly increasing  q = seq(min(lambda_siteE$mean_lambda, na.rm = TRUE),           max(lambda_siteE$mean_lambda, na.rm = TRUE),           length.out = 6L)}
lambda_siteE$band = cut(  lambda_siteE$mean_lambda,  breaks = q, include.lowest = TRUE,  labels = c("very-low", "low", "medium", "high", "very-high"))
# Map: discrete risk bands (Option C)p_lambdaE_bands = ggplot2::ggplot(lambda_siteE, ggplot2::aes(x = x, y = y, fill = band)) +  ggplot2::geom_tile() +  ggplot2::scale_fill_brewer(palette = "RdYlBu", direction = 1, name = "Site invasibility") +  ggplot2::labs(title = "Site invasibility bands (quintiles) — Option E",                x = "Longitude", y = "Latitude") +  ggplot2::theme_minimal(base_size = 12) +  ggplot2::theme(panel.grid = ggplot2::element_blank())
if (exists("rsa")) {  p_lambdaE_bands = p_lambdaE_bands +    ggplot2::geom_sf(data = rsa, inherit.aes = FALSE, fill = NA, color = "black", size = 0.3)}
print(p_lambdaE_bands)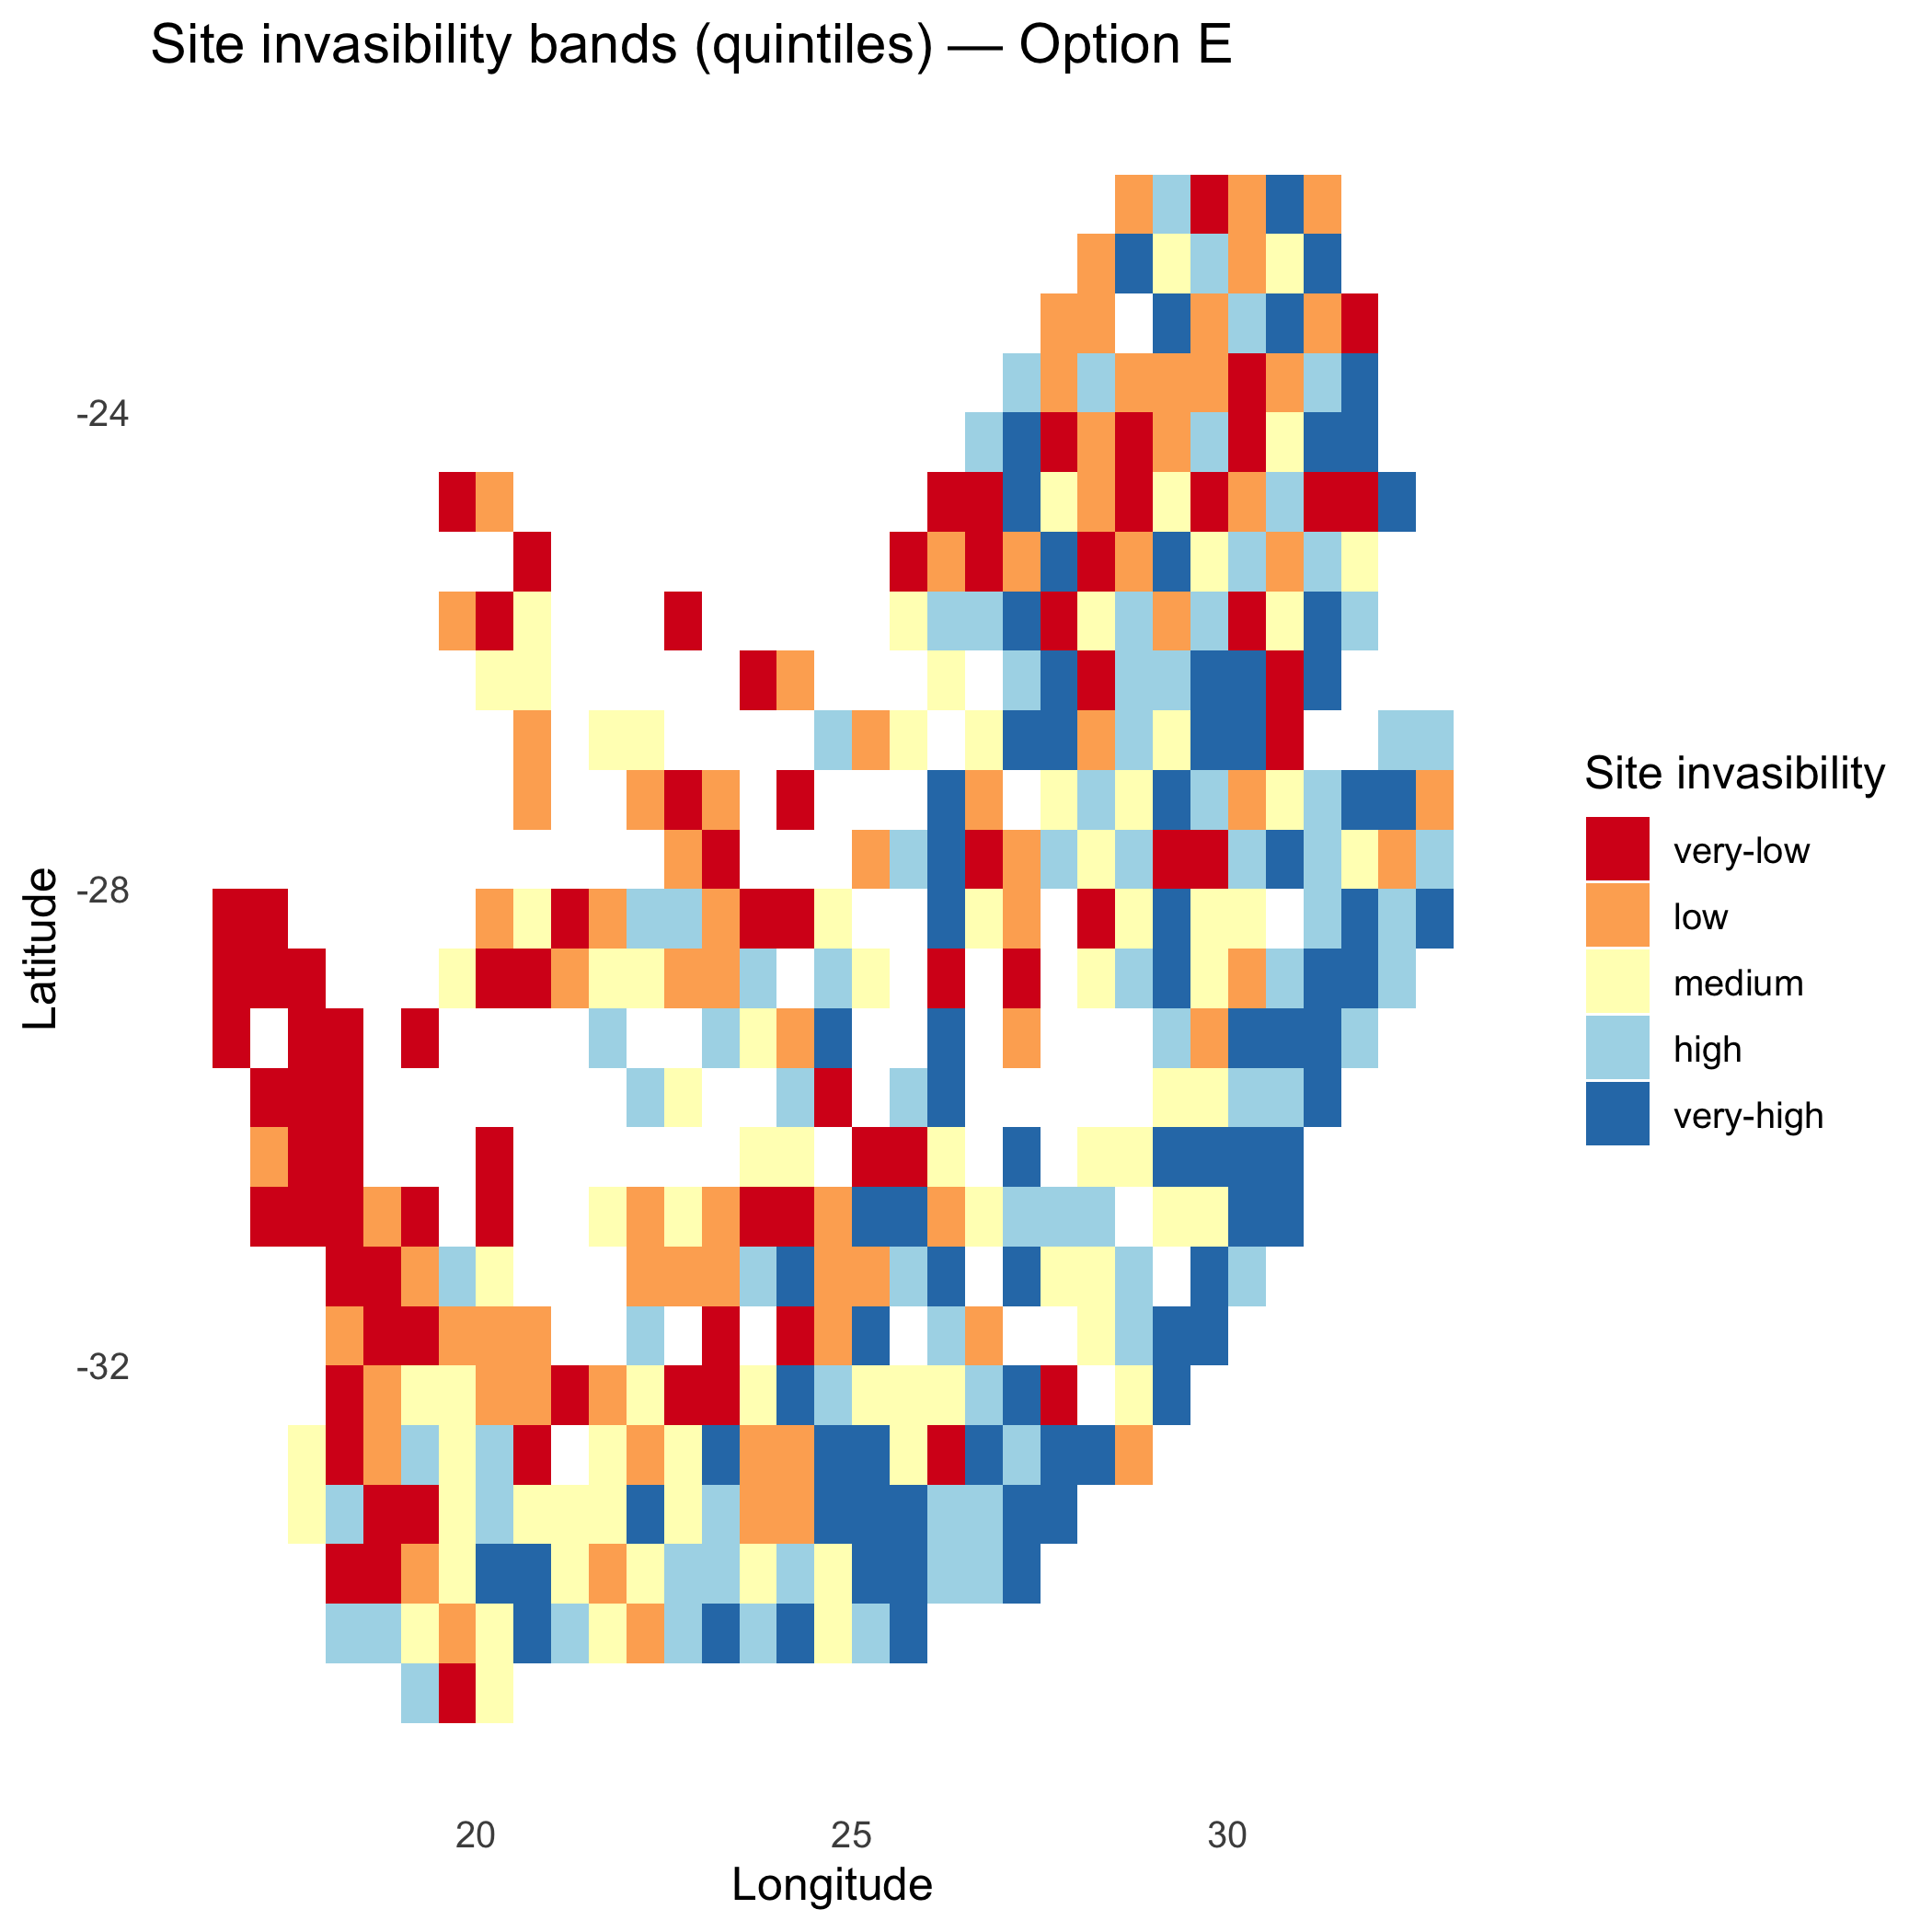
:chart_with_upwards_trend: Figure 5:Invasibility bands with signed saturation effects. Warm zones indicate contexts where saturation/facilitation elevates fitness (positive
); cool zones mark inhibitory responses (negative ).
Predict establishment probability using different methods
Section titled “Predict establishment probability using different methods”compute_establishment_probability() maps
:hourglass_flowing_sand: Inputs and outputs (at a glance): Inputs: either lambda_is or the components sigma or tau) depending on method; optional site_df for maps. Output: site × invader matrix
:information_source: Why this matters: A probability scale is intuitive for planning and communication. The link choice controls steepness around
:warning: Practical checks and tips:
- If maps are flat at ~0.5, your scale (
sigma/tau) may be too large or. - Use predictive SD when uncertainty communication is important (edges of trait space; sparse data).
- For binary maps, co-report a probabilistic view where decisions are marginal.
Method A: Probit
Section titled “Method A: Probit ”A normal CDF turns
outP = invasimapr::compute_establishment_probability( r_is_z, C_is_z, S_is_z, gamma = gamma, alpha = alpha, beta = beta, # or pass lambda_is directly method = "probit", sigma = 1, site_df = site_df, return_long = TRUE, make_plots = TRUE)str(outP, 1)#> List of 7#> $ p_is : num [1:415, 1:10] 0.2057 0.0118 0.5943 0.8867 0.3753 ...#> ..- attr(*, "dimnames")=List of 2#> $ lambda_is : num [1:415, 1:10] -0.821 -2.265 0.239 1.209 -0.318 ...#> ..- attr(*, "dimnames")=List of 2#> $ sigma_used : num 1#> $ method : chr "probit"#> $ option_label: chr "probit"#> $ prob_long : tibble [4,150 × 7] (S3: tbl_df/tbl/data.frame)#> $ plots :List of 3:bar_chart: Maps the mean establishment probability
# ---- 1) Get a long table (site × invader → probability) ----------------------p_long = if (!is.null(outP$p_long)) {  outP$p_long} else if (!is.null(outP$prob_long)) {  outP$prob_long} else if (!is.null(outP$lambda_long)) {  # last resort: recompute prob from lambda using the same sigma you passed in  sigma_used = attr(outP, "sigma") %||% 1  dplyr::mutate(outP$lambda_long, p = pnorm(lambda / sigma_used))} else {  stop("No probability table found in outP (looked for p_long / prob_long / lambda_long).")}
# Standardise column names we needp_long = p_long |>  dplyr::rename(prob = dplyr::any_of(c("p","prob","probability","val"))) |>  dplyr::select(site, invader, prob) |>  dplyr::mutate(site = as.character(site), invader = as.character(invader))
# ---- 2) Site mean probability map -------------------------------------------p_site = p_long |>  dplyr::group_by(site) |>  dplyr::summarise(mean_p = mean(prob, na.rm = TRUE), .groups = "drop") |>  dplyr::left_join(site_df, by = "site")
p_map = ggplot2::ggplot(p_site, ggplot2::aes(x = x, y = y, fill = mean_p)) +  ggplot2::geom_tile() +  ggplot2::scale_fill_viridis_c(name = "Mean P(establish)", limits = c(0,1)) +  ggplot2::labs(title = "Probit: site mean establishment probability",                x = "Longitude", y = "Latitude") +  ggplot2::theme_minimal(base_size = 12) +  ggplot2::theme(panel.grid = ggplot2::element_blank())if (exists("rsa")) p_map = p_map + ggplot2::geom_sf(data = rsa, inherit.aes = FALSE,                                                     fill = NA, color = "black", size = 0.3)print(p_map)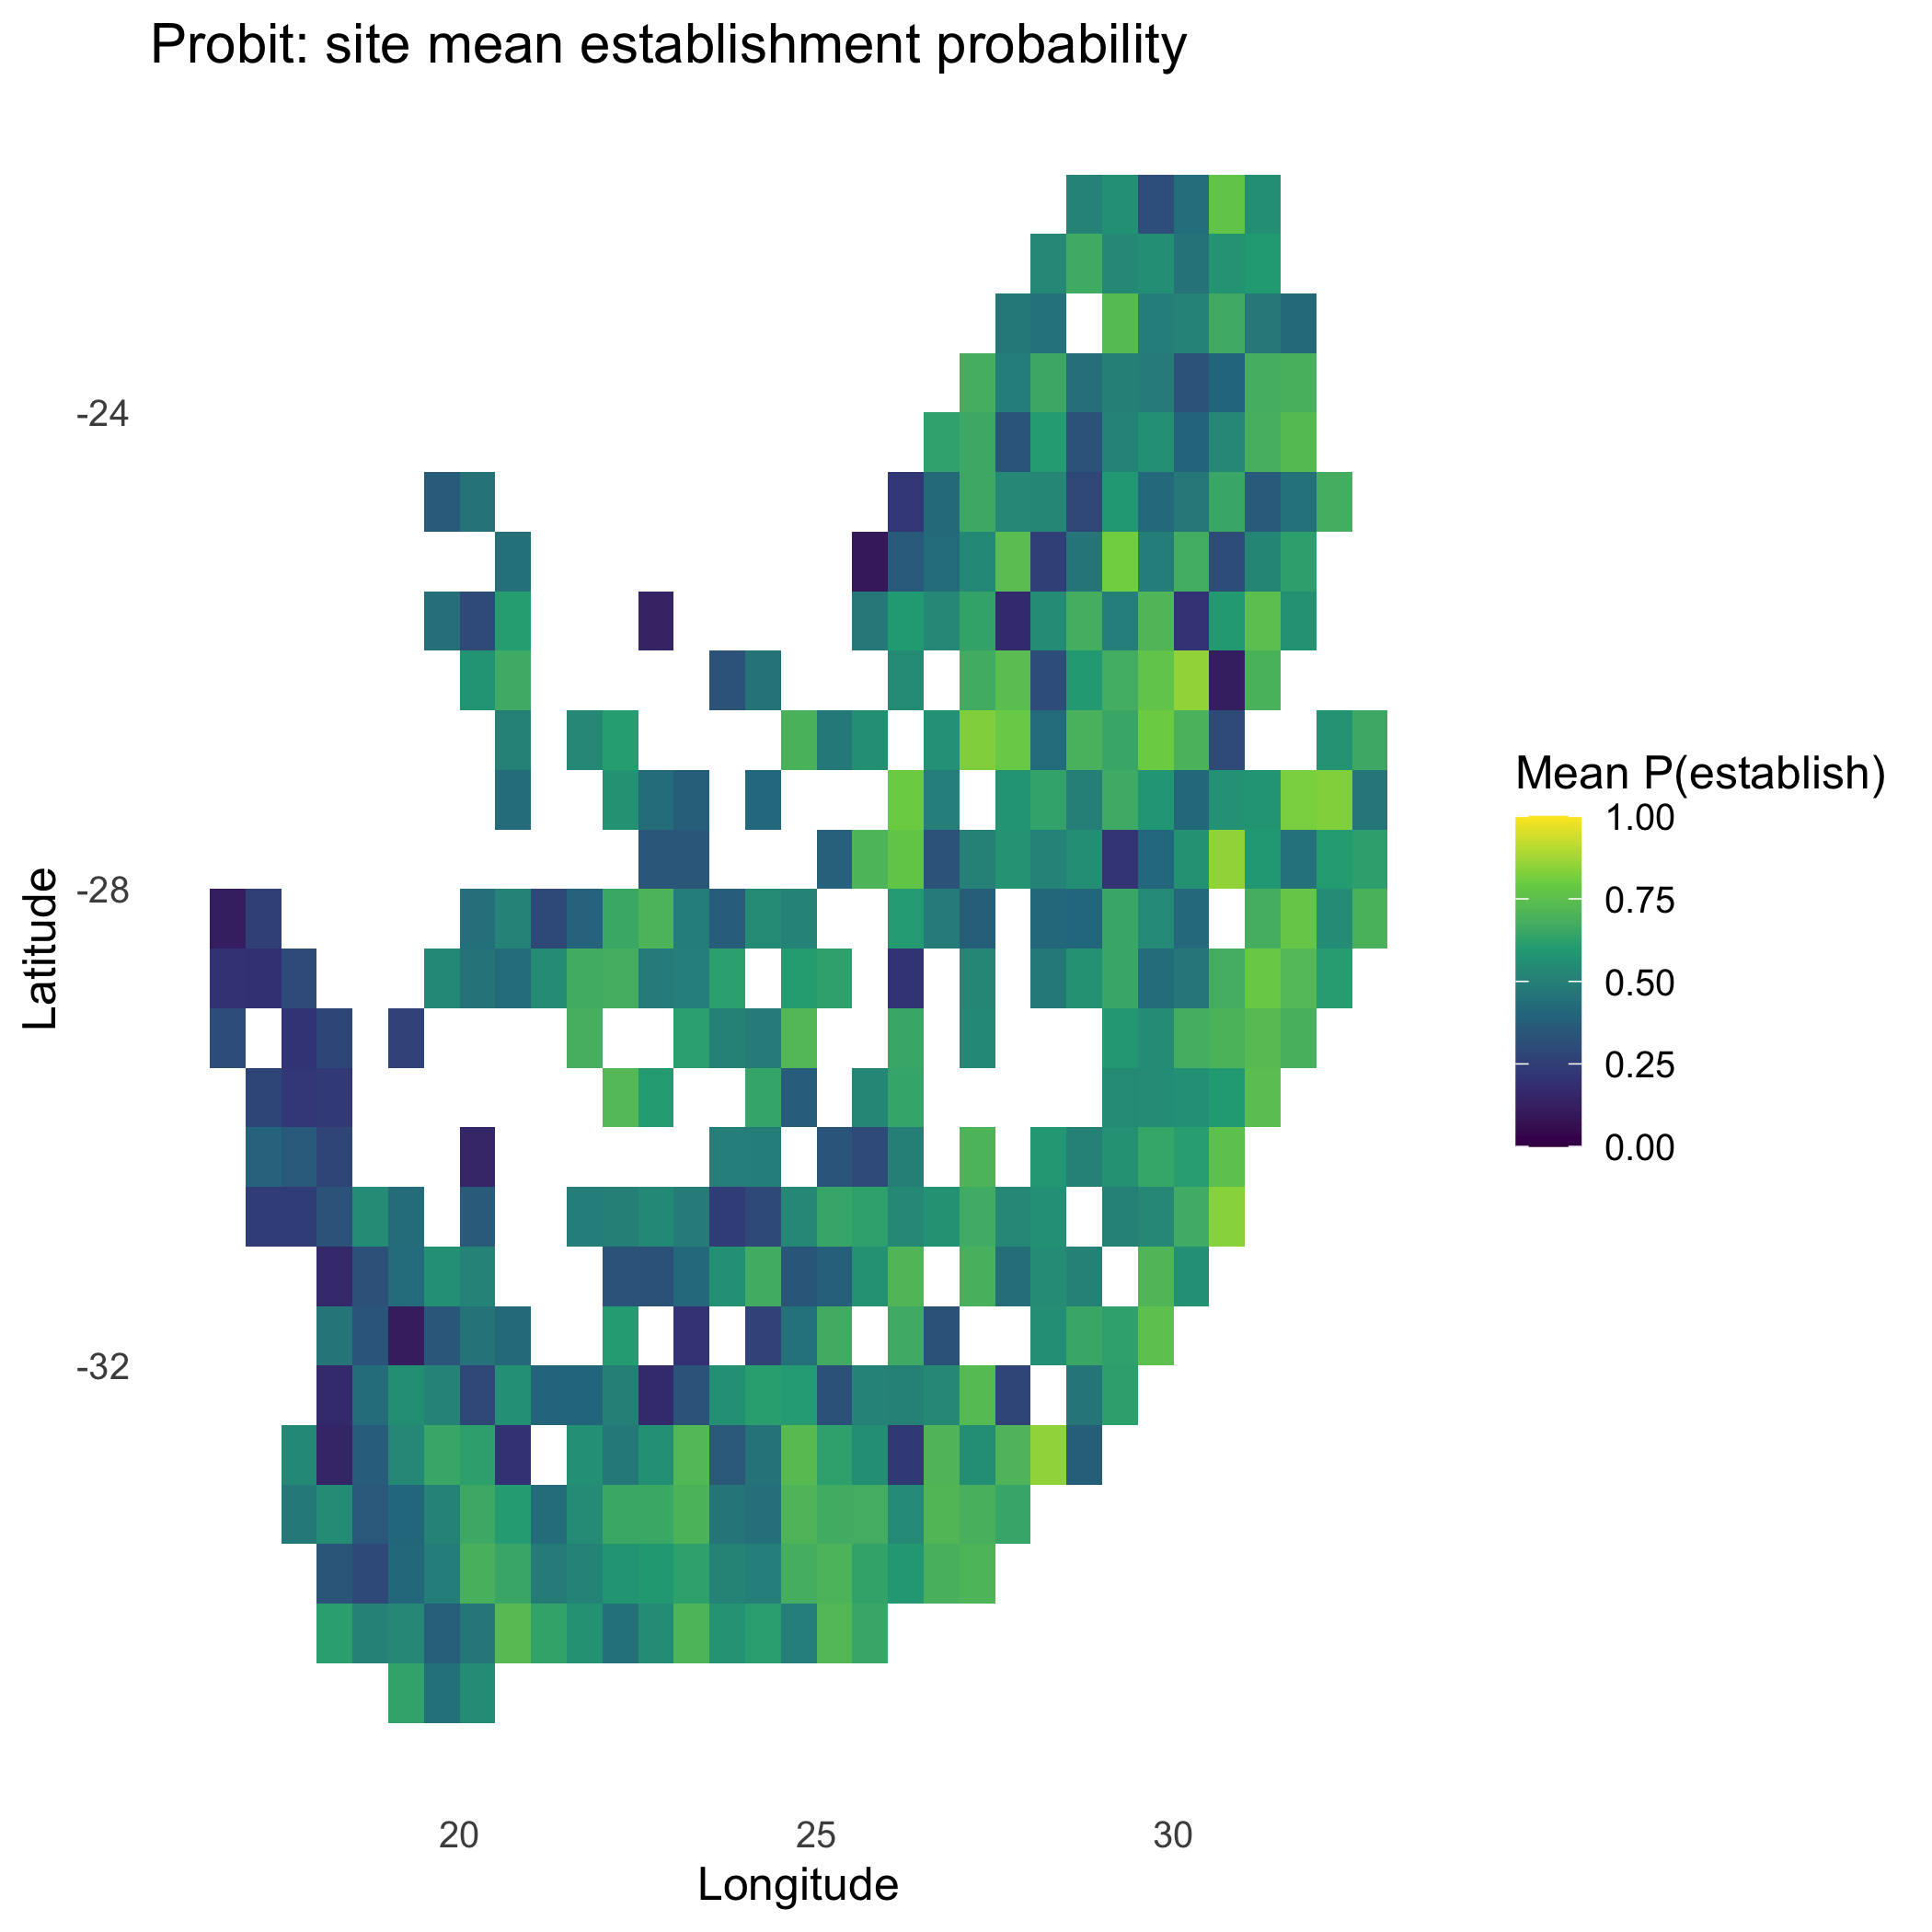
# ---- 3) Expected # establishing invaders per site (sum of probabilities) ----p_site_exp = p_long |>  dplyr::group_by(site) |>  dplyr::summarise(expected_n = sum(prob, na.rm = TRUE), .groups = "drop") |>  dplyr::left_join(site_df, by = "site")
p_exp = ggplot2::ggplot(p_site_exp, ggplot2::aes(x = x, y = y, fill = expected_n)) +  ggplot2::geom_tile() +  ggplot2::scale_fill_viridis_c(name = "Expected # establishing") +  ggplot2::labs(title = "Probit: expected # establishing invaders (per site)",                x = "Longitude", y = "Latitude") +  ggplot2::theme_minimal(base_size = 12) +  ggplot2::theme(panel.grid = ggplot2::element_blank())if (exists("rsa")) p_exp = p_exp + ggplot2::geom_sf(data = rsa, inherit.aes = FALSE,                                                     fill = NA, color = "black", size = 0.3)print(p_exp)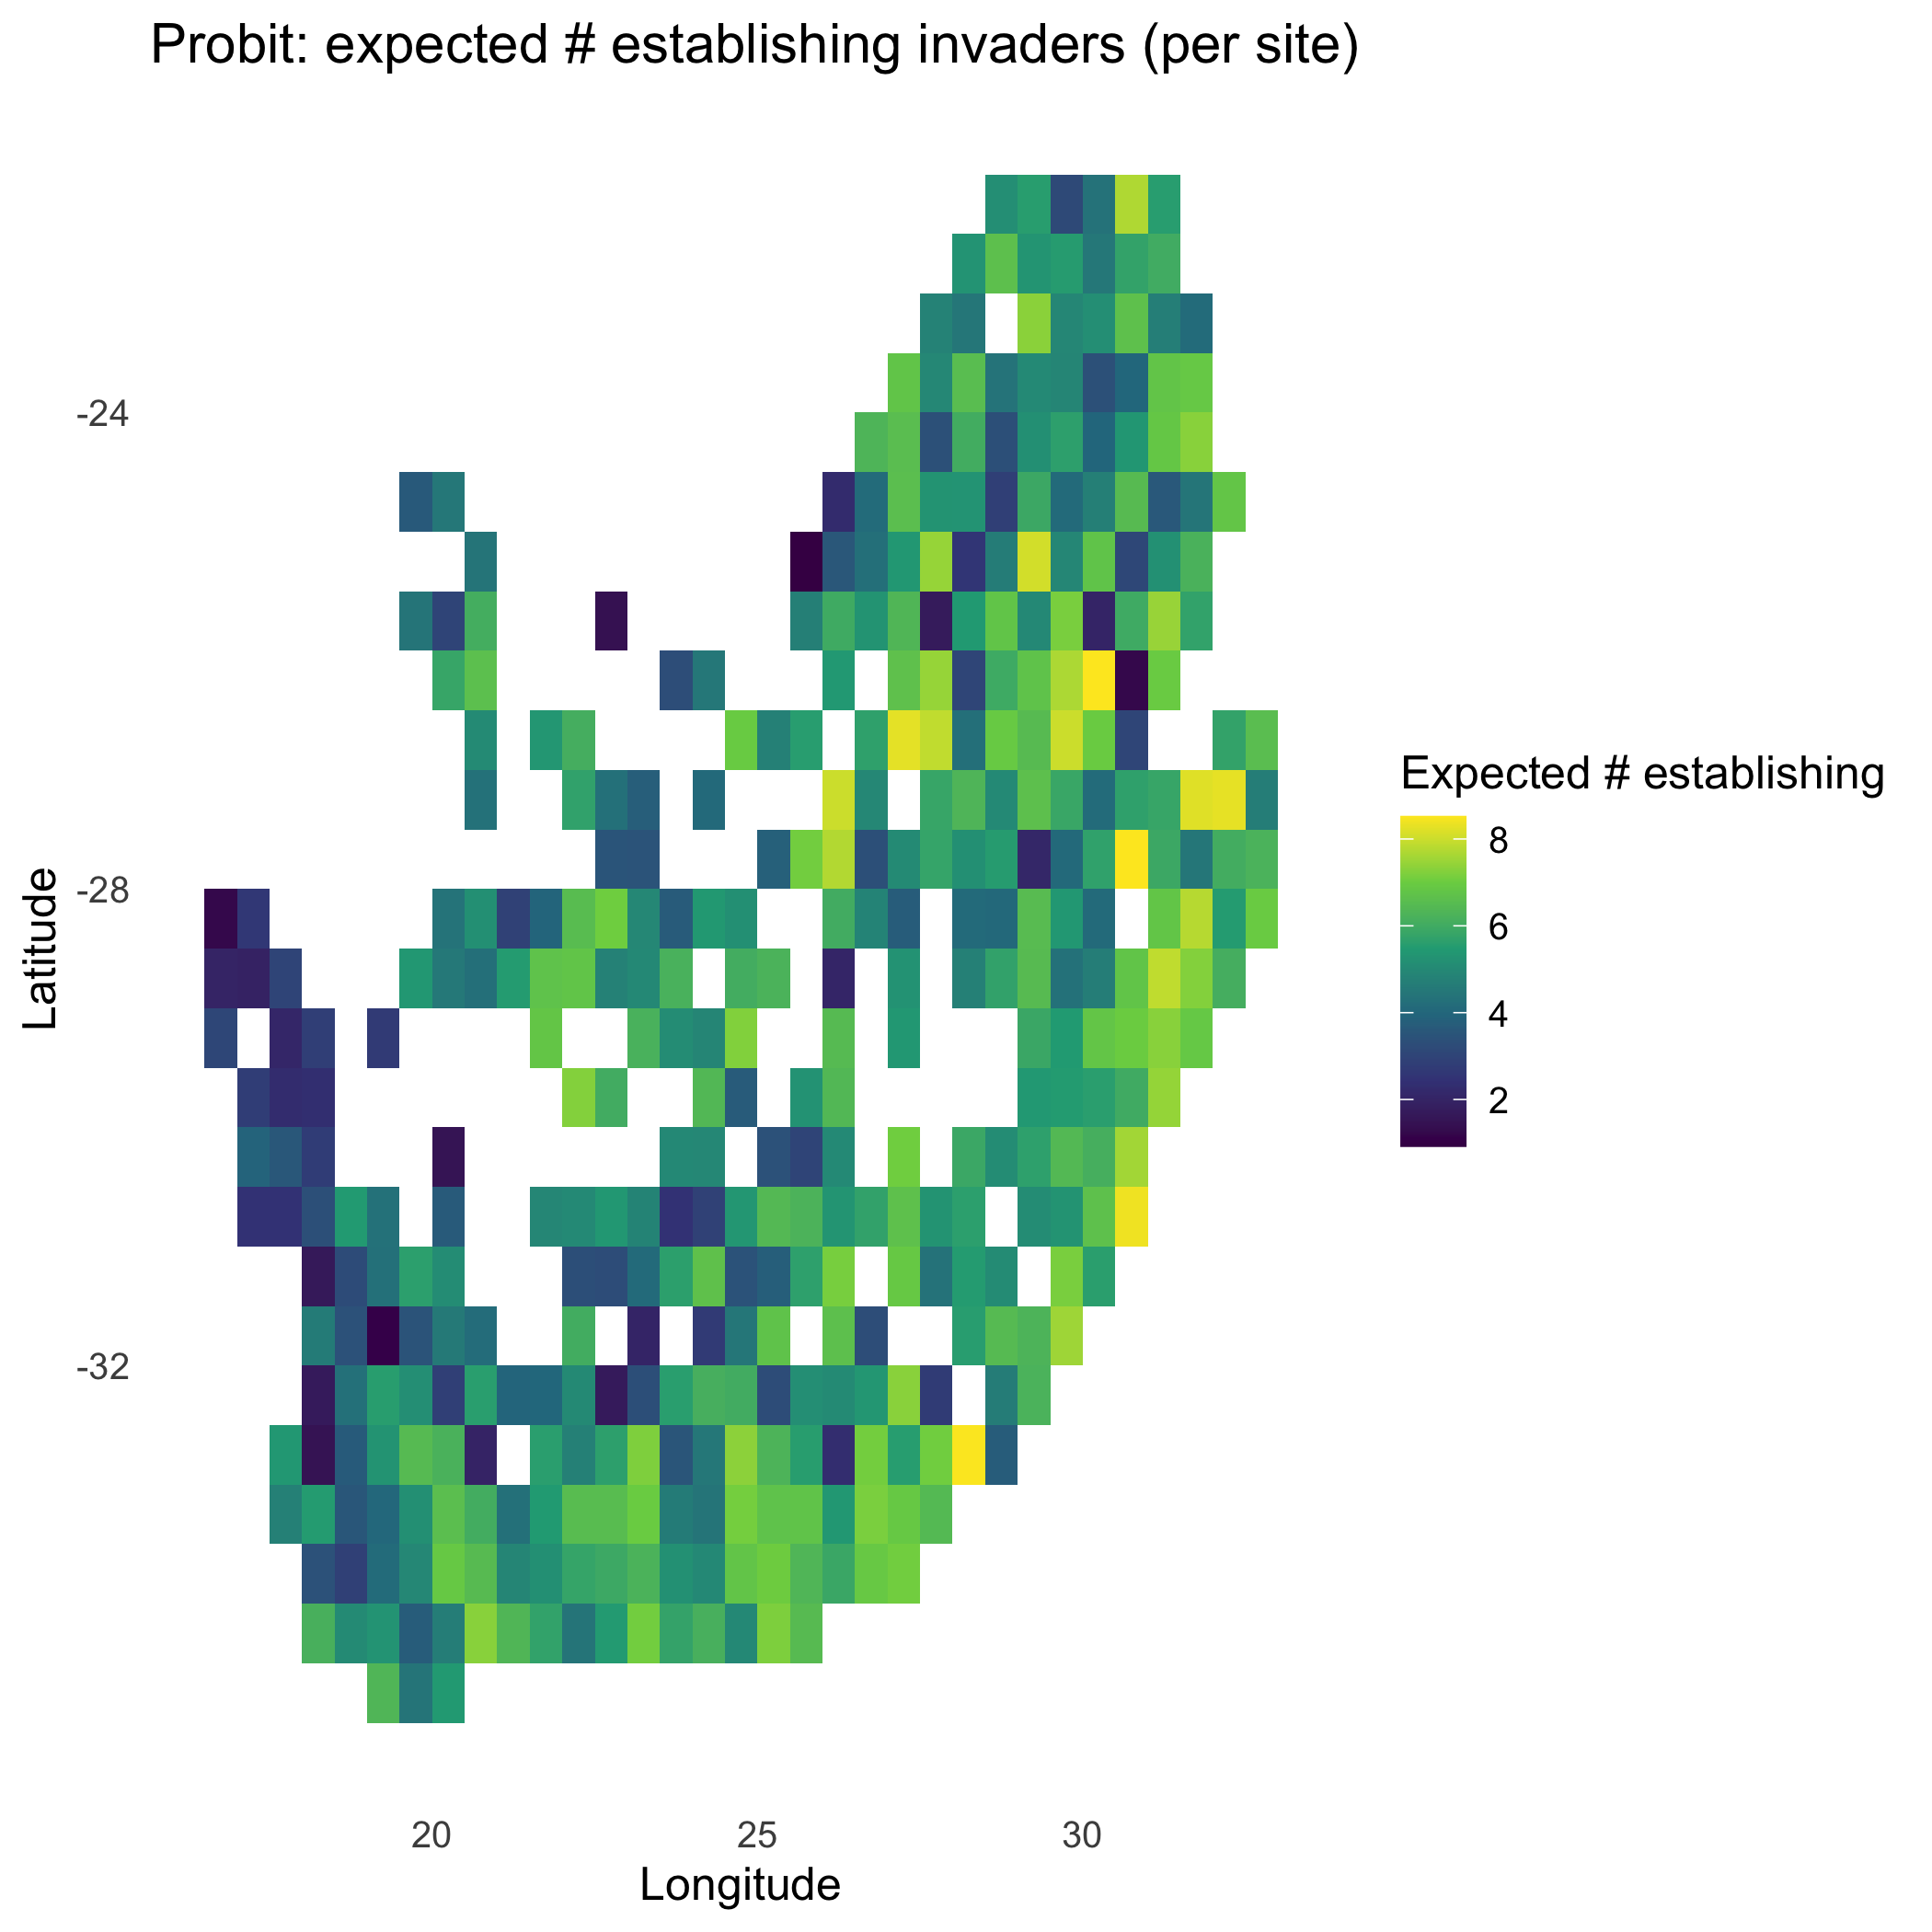
# ---- 4) Optional: discrete “risk bands” (quintiles) for mean probability ----q = stats::quantile(p_site$mean_p, probs = seq(0,1,0.2), na.rm = TRUE)if (length(unique(q)) < 6L) {  q = seq(min(p_site$mean_p, na.rm = TRUE), max(p_site$mean_p, na.rm = TRUE), length.out = 6L)}p_site$band = cut(p_site$mean_p, breaks = q, include.lowest = TRUE,                   labels = c("very-low","low","medium","high","very-high"))
p_band = ggplot2::ggplot(p_site, ggplot2::aes(x = x, y = y, fill = band)) +  ggplot2::geom_tile() +  ggplot2::scale_fill_brewer(palette = "RdYlBu", direction = 1, name = "Site invasibility") +  ggplot2::labs(title = "Probit: site invasibility bands (quintiles)",                x = "Longitude", y = "Latitude") +  ggplot2::theme_minimal(base_size = 12) +  ggplot2::theme(panel.grid = ggplot2::element_blank())if (exists("rsa")) p_band = p_band + ggplot2::geom_sf(data = rsa, inherit.aes = FALSE,                                                       fill = NA, color = "black", size = 0.3)print(p_band)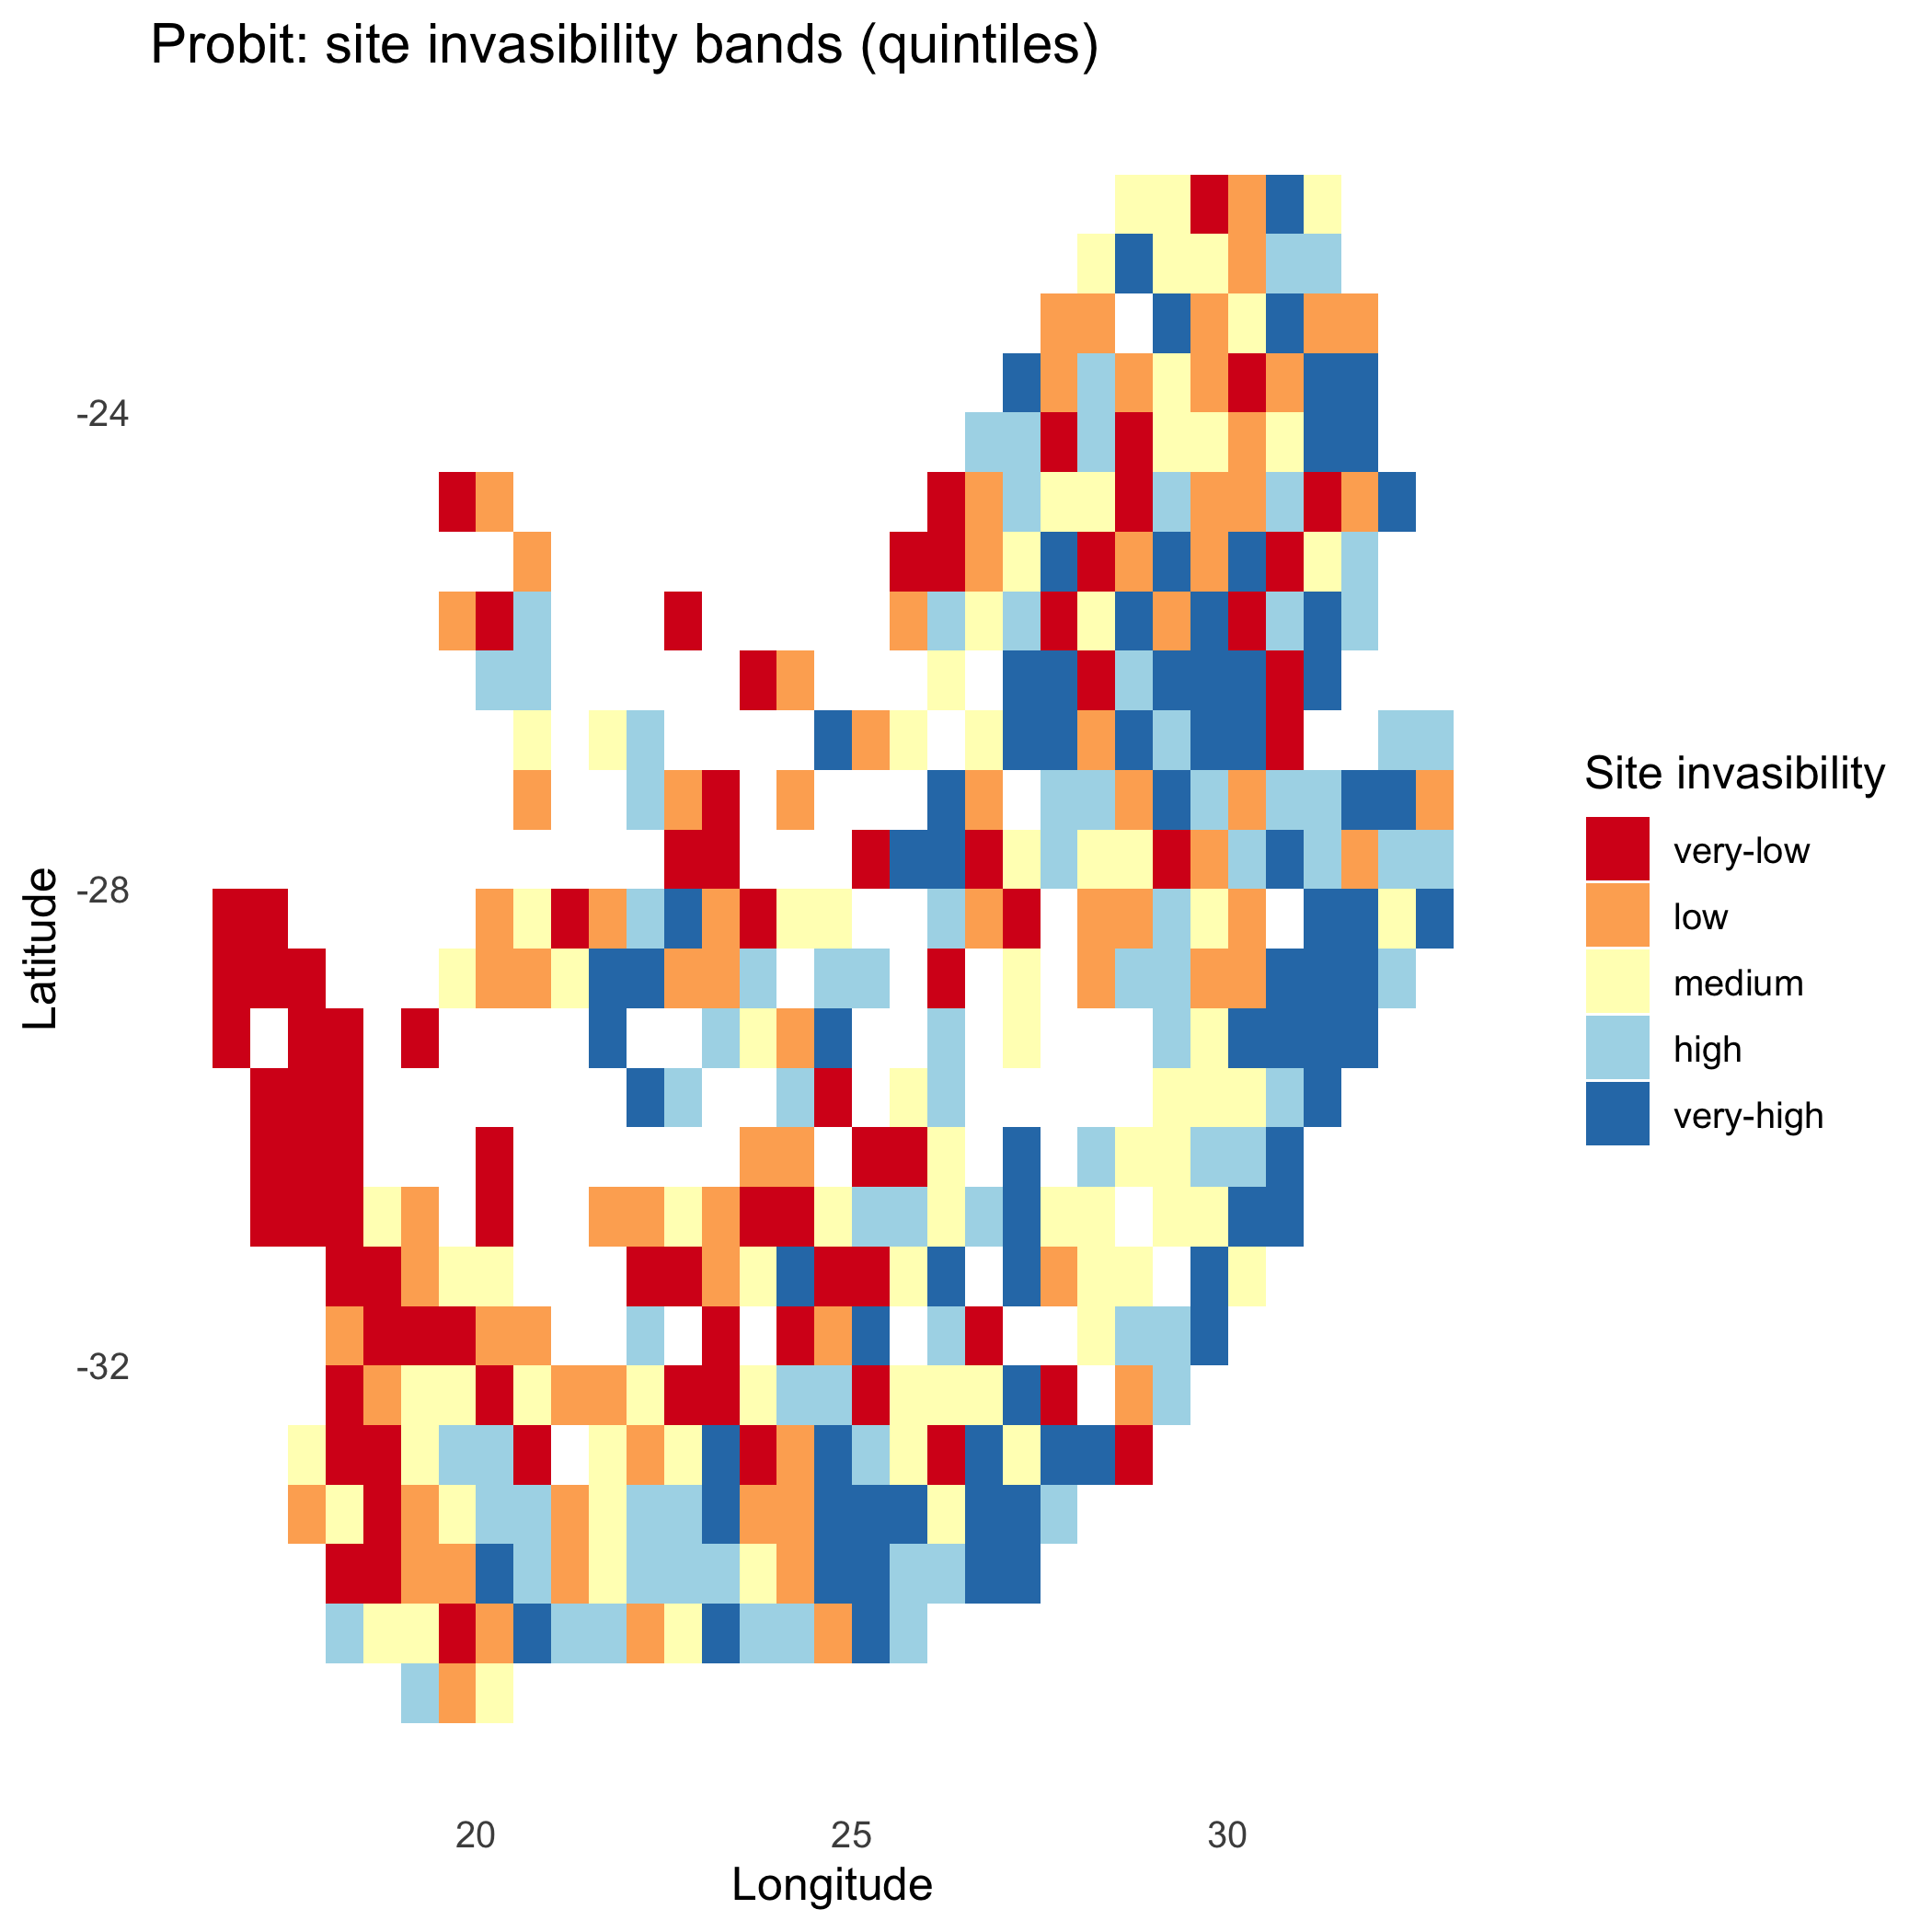
# ---- 5) Quick invader ranking by mean establishment probability --------------invader_rank = p_long |>  dplyr::group_by(invader) |>  dplyr::summarise(mean_p = mean(prob, na.rm = TRUE), .groups = "drop") |>  dplyr::arrange(dplyr::desc(mean_p))
print(head(invader_rank, 10))#> # A tibble: 10 × 2#>    invader mean_p#>    <chr>    <dbl>#>  1 inv5     0.549#>  2 inv6     0.542#>  3 inv10    0.542#>  4 inv7     0.537#>  5 inv4     0.532#>  6 inv9     0.524#>  7 inv8     0.524#>  8 inv3     0.505#>  9 inv1     0.483#> 10 inv2     0.477
:chart_with_upwards_trend: Figure 6: Probit-linked establishment probabilities with
. Panels show site-mean , expected count of establishing invaders, and discrete bands; mid-probability contours track .
:bulb: Interpretation: Smaller
Method B: Logistic
Section titled “Method B: Logistic ”A logistic link with scale
outL = invasimapr::compute_establishment_probability( r_is_z, C_is_z, S_is_z, gamma = gamma, alpha = alpha, beta = beta, method = "logit", tau = 1, site_df = site_df, return_long = TRUE, make_plots = TRUE)str(outL, 1)#> List of 7#> $ p_is : num [1:415, 1:10] 0.3055 0.0941 0.5594 0.7702 0.4212 ...#> ..- attr(*, "dimnames")=List of 2#> $ lambda_is : num [1:415, 1:10] -0.821 -2.265 0.239 1.209 -0.318 ...#> ..- attr(*, "dimnames")=List of 2#> $ sigma_used : NULL#> $ method : chr "logit"#> $ option_label: chr "logit"#> $ prob_long : tibble [4,150 × 7] (S3: tbl_df/tbl/data.frame)#> $ plots :List of 3:bar_chart: Analogous to the probit workflow but with a logistic link scaled by
# ---- 1) Get a long table (site × invader → probability) ----------------------p_long = if (!is.null(outL$p_long)) {  outL$p_long} else if (!is.null(outL$prob_long)) {  outL$prob_long} else if (!is.null(outL$lambda_long)) {  # Recompute from lambda using the same tau you passed in (default 1)  tau_used = attr(outL, "tau") %||% 1  dplyr::mutate(outL$lambda_long, p = plogis(lambda / tau_used))} else {  stop("No probability table found in outL (looked for p_long / prob_long / lambda_long).")}
p_long = p_long |>  dplyr::rename(prob = dplyr::any_of(c("p","prob","probability","val"))) |>  dplyr::select(site, invader, prob) |>  dplyr::mutate(site = as.character(site), invader = as.character(invader))
# ---- 2) Site mean probability map -------------------------------------------p_site = p_long |>  dplyr::group_by(site) |>  dplyr::summarise(mean_p = mean(prob, na.rm = TRUE), .groups = "drop") |>  dplyr::left_join(site_df, by = "site")
p_map = ggplot2::ggplot(p_site, ggplot2::aes(x = x, y = y, fill = mean_p)) +  ggplot2::geom_tile() +  ggplot2::scale_fill_viridis_c(name = "Mean P(establish)", limits = c(0,1)) +  ggplot2::labs(title = "Logistic: site mean establishment probability",                x = "Longitude", y = "Latitude") +  ggplot2::theme_minimal(base_size = 12) +  ggplot2::theme(panel.grid = ggplot2::element_blank())if (exists("rsa")) p_map = p_map + ggplot2::geom_sf(data = rsa, inherit.aes = FALSE,                                                     fill = NA, color = "black", size = 0.3)print(p_map)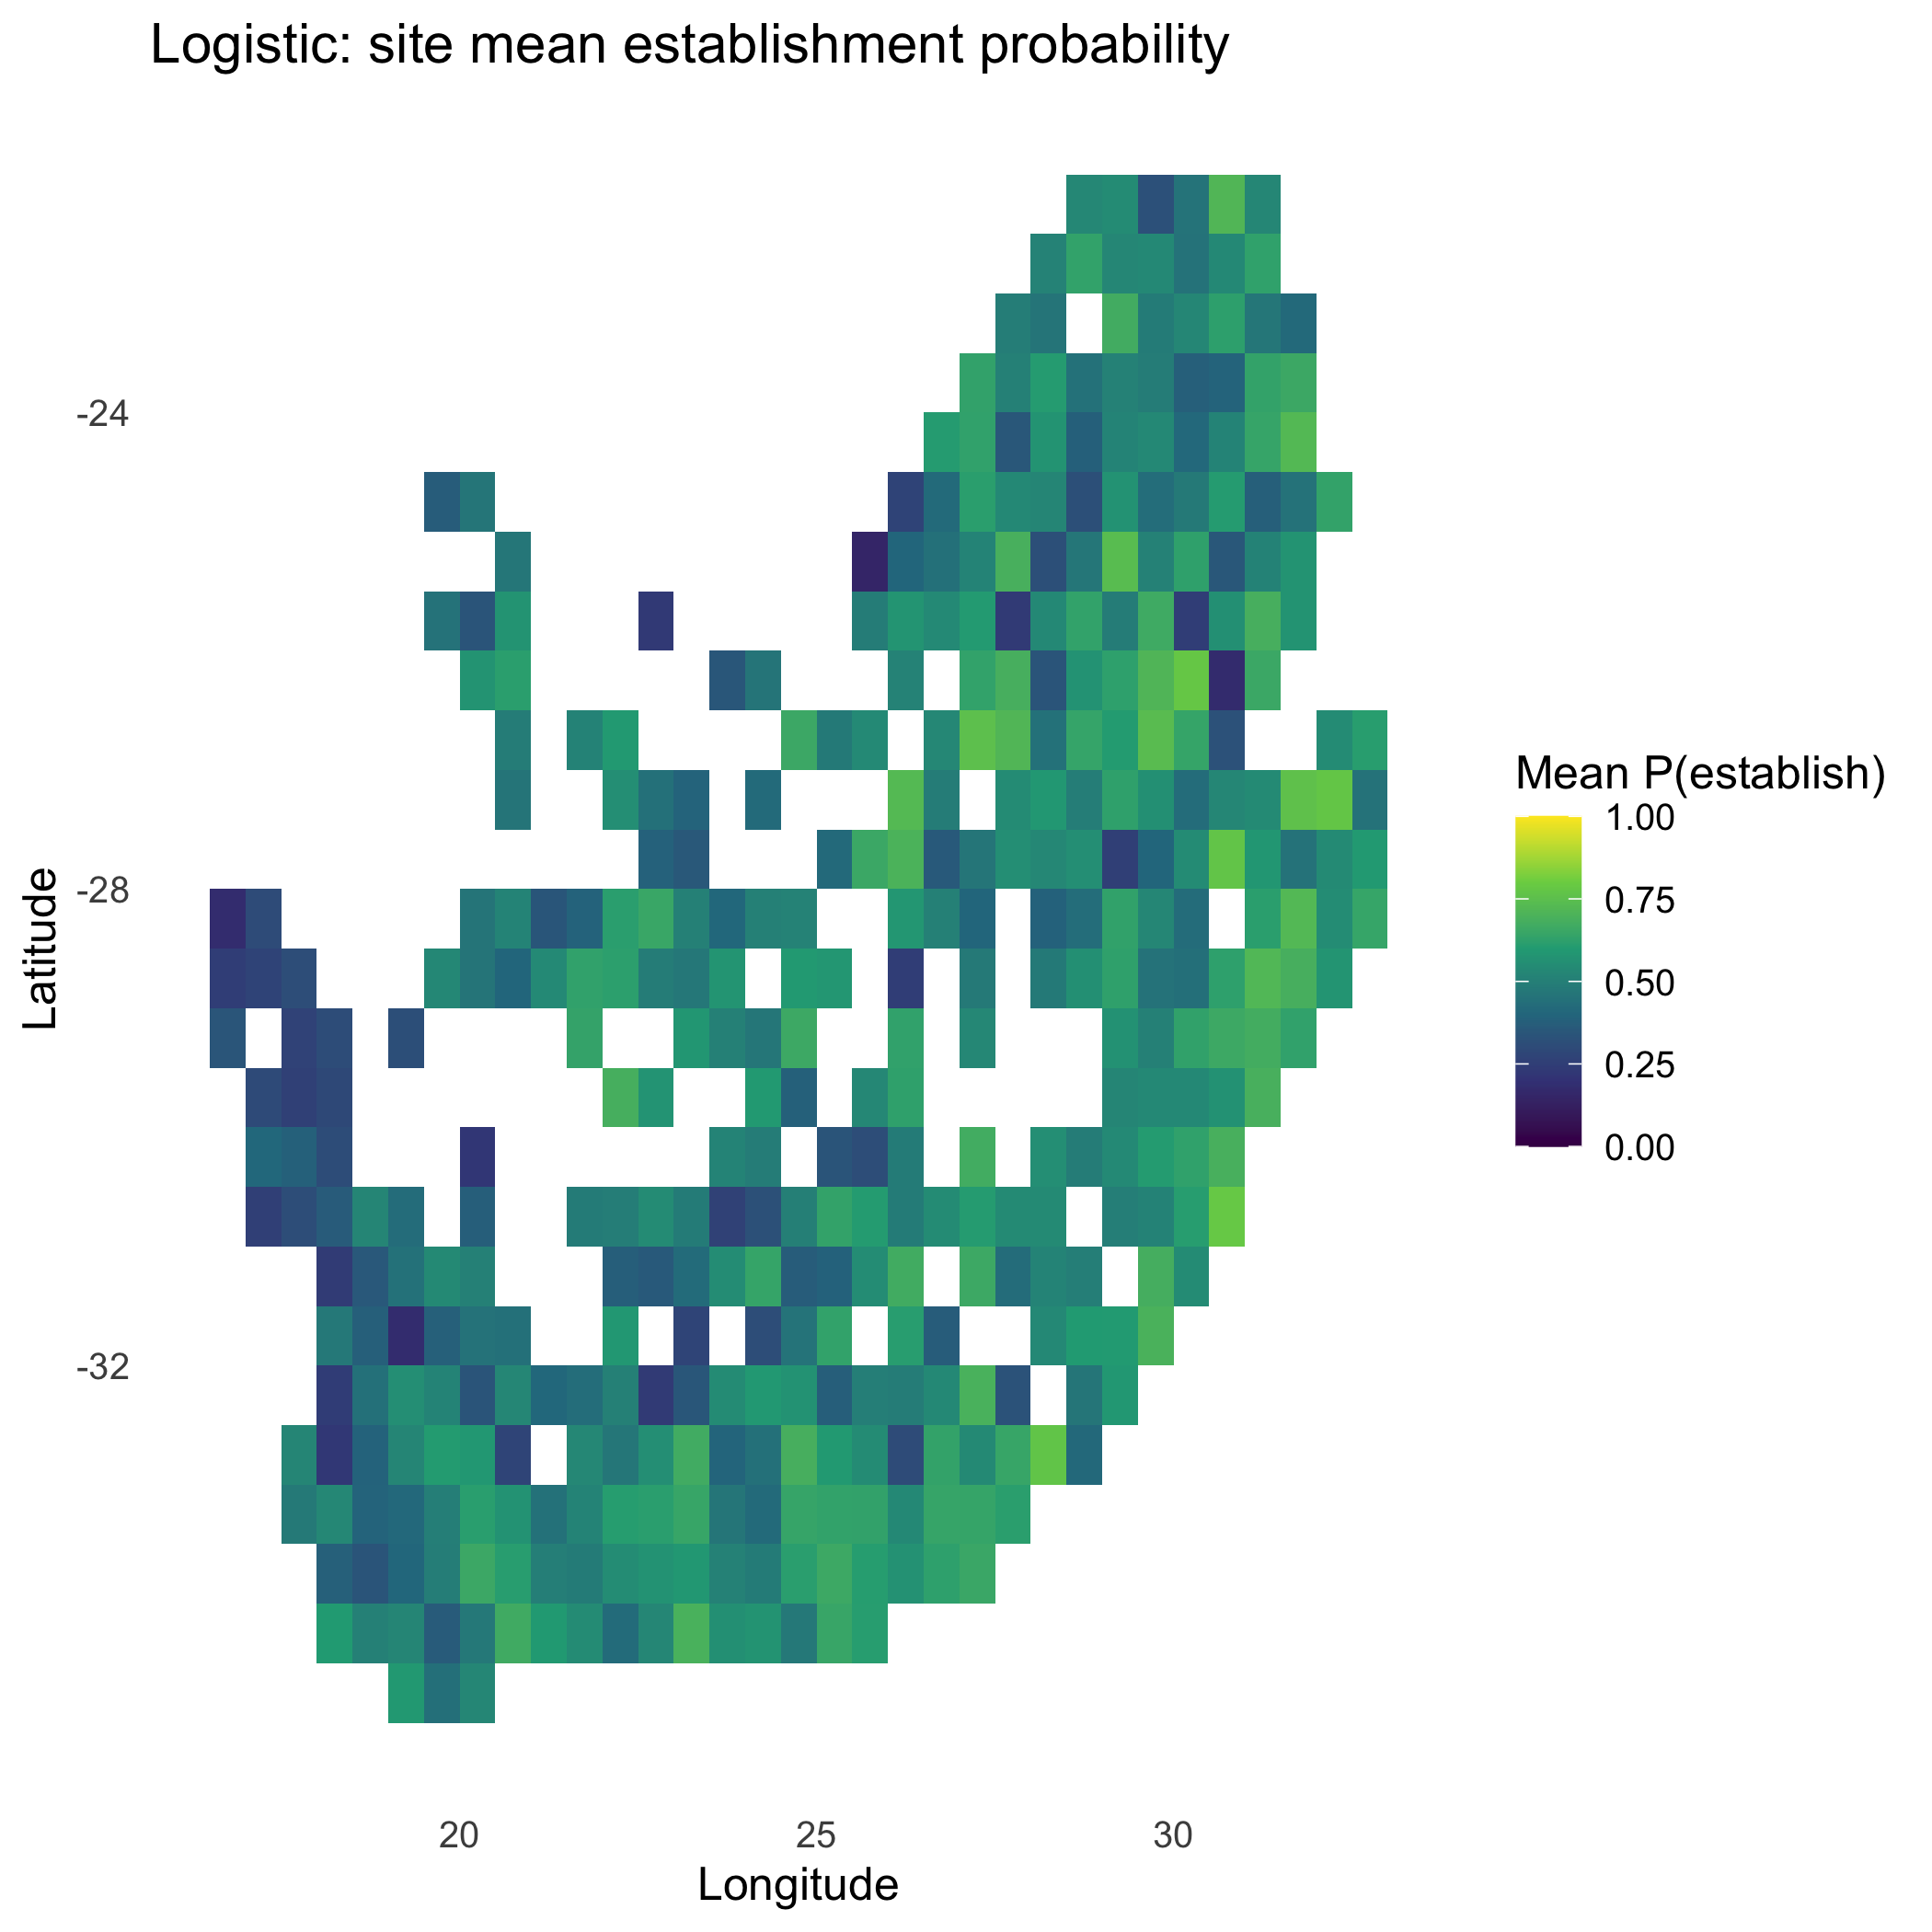
# ---- 3) Expected # establishing invaders per site ----------------------------p_site_exp = p_long |>  dplyr::group_by(site) |>  dplyr::summarise(expected_n = sum(prob, na.rm = TRUE), .groups = "drop") |>  dplyr::left_join(site_df, by = "site")
p_exp = ggplot2::ggplot(p_site_exp, ggplot2::aes(x = x, y = y, fill = expected_n)) +  ggplot2::geom_tile() +  ggplot2::scale_fill_viridis_c(name = "Expected # establishing") +  ggplot2::labs(title = "Logistic: expected # establishing invaders (per site)",                x = "Longitude", y = "Latitude") +  ggplot2::theme_minimal(base_size = 12) +  ggplot2::theme(panel.grid = ggplot2::element_blank())if (exists("rsa")) p_exp = p_exp + ggplot2::geom_sf(data = rsa, inherit.aes = FALSE,                                                     fill = NA, color = "black", size = 0.3)print(p_exp)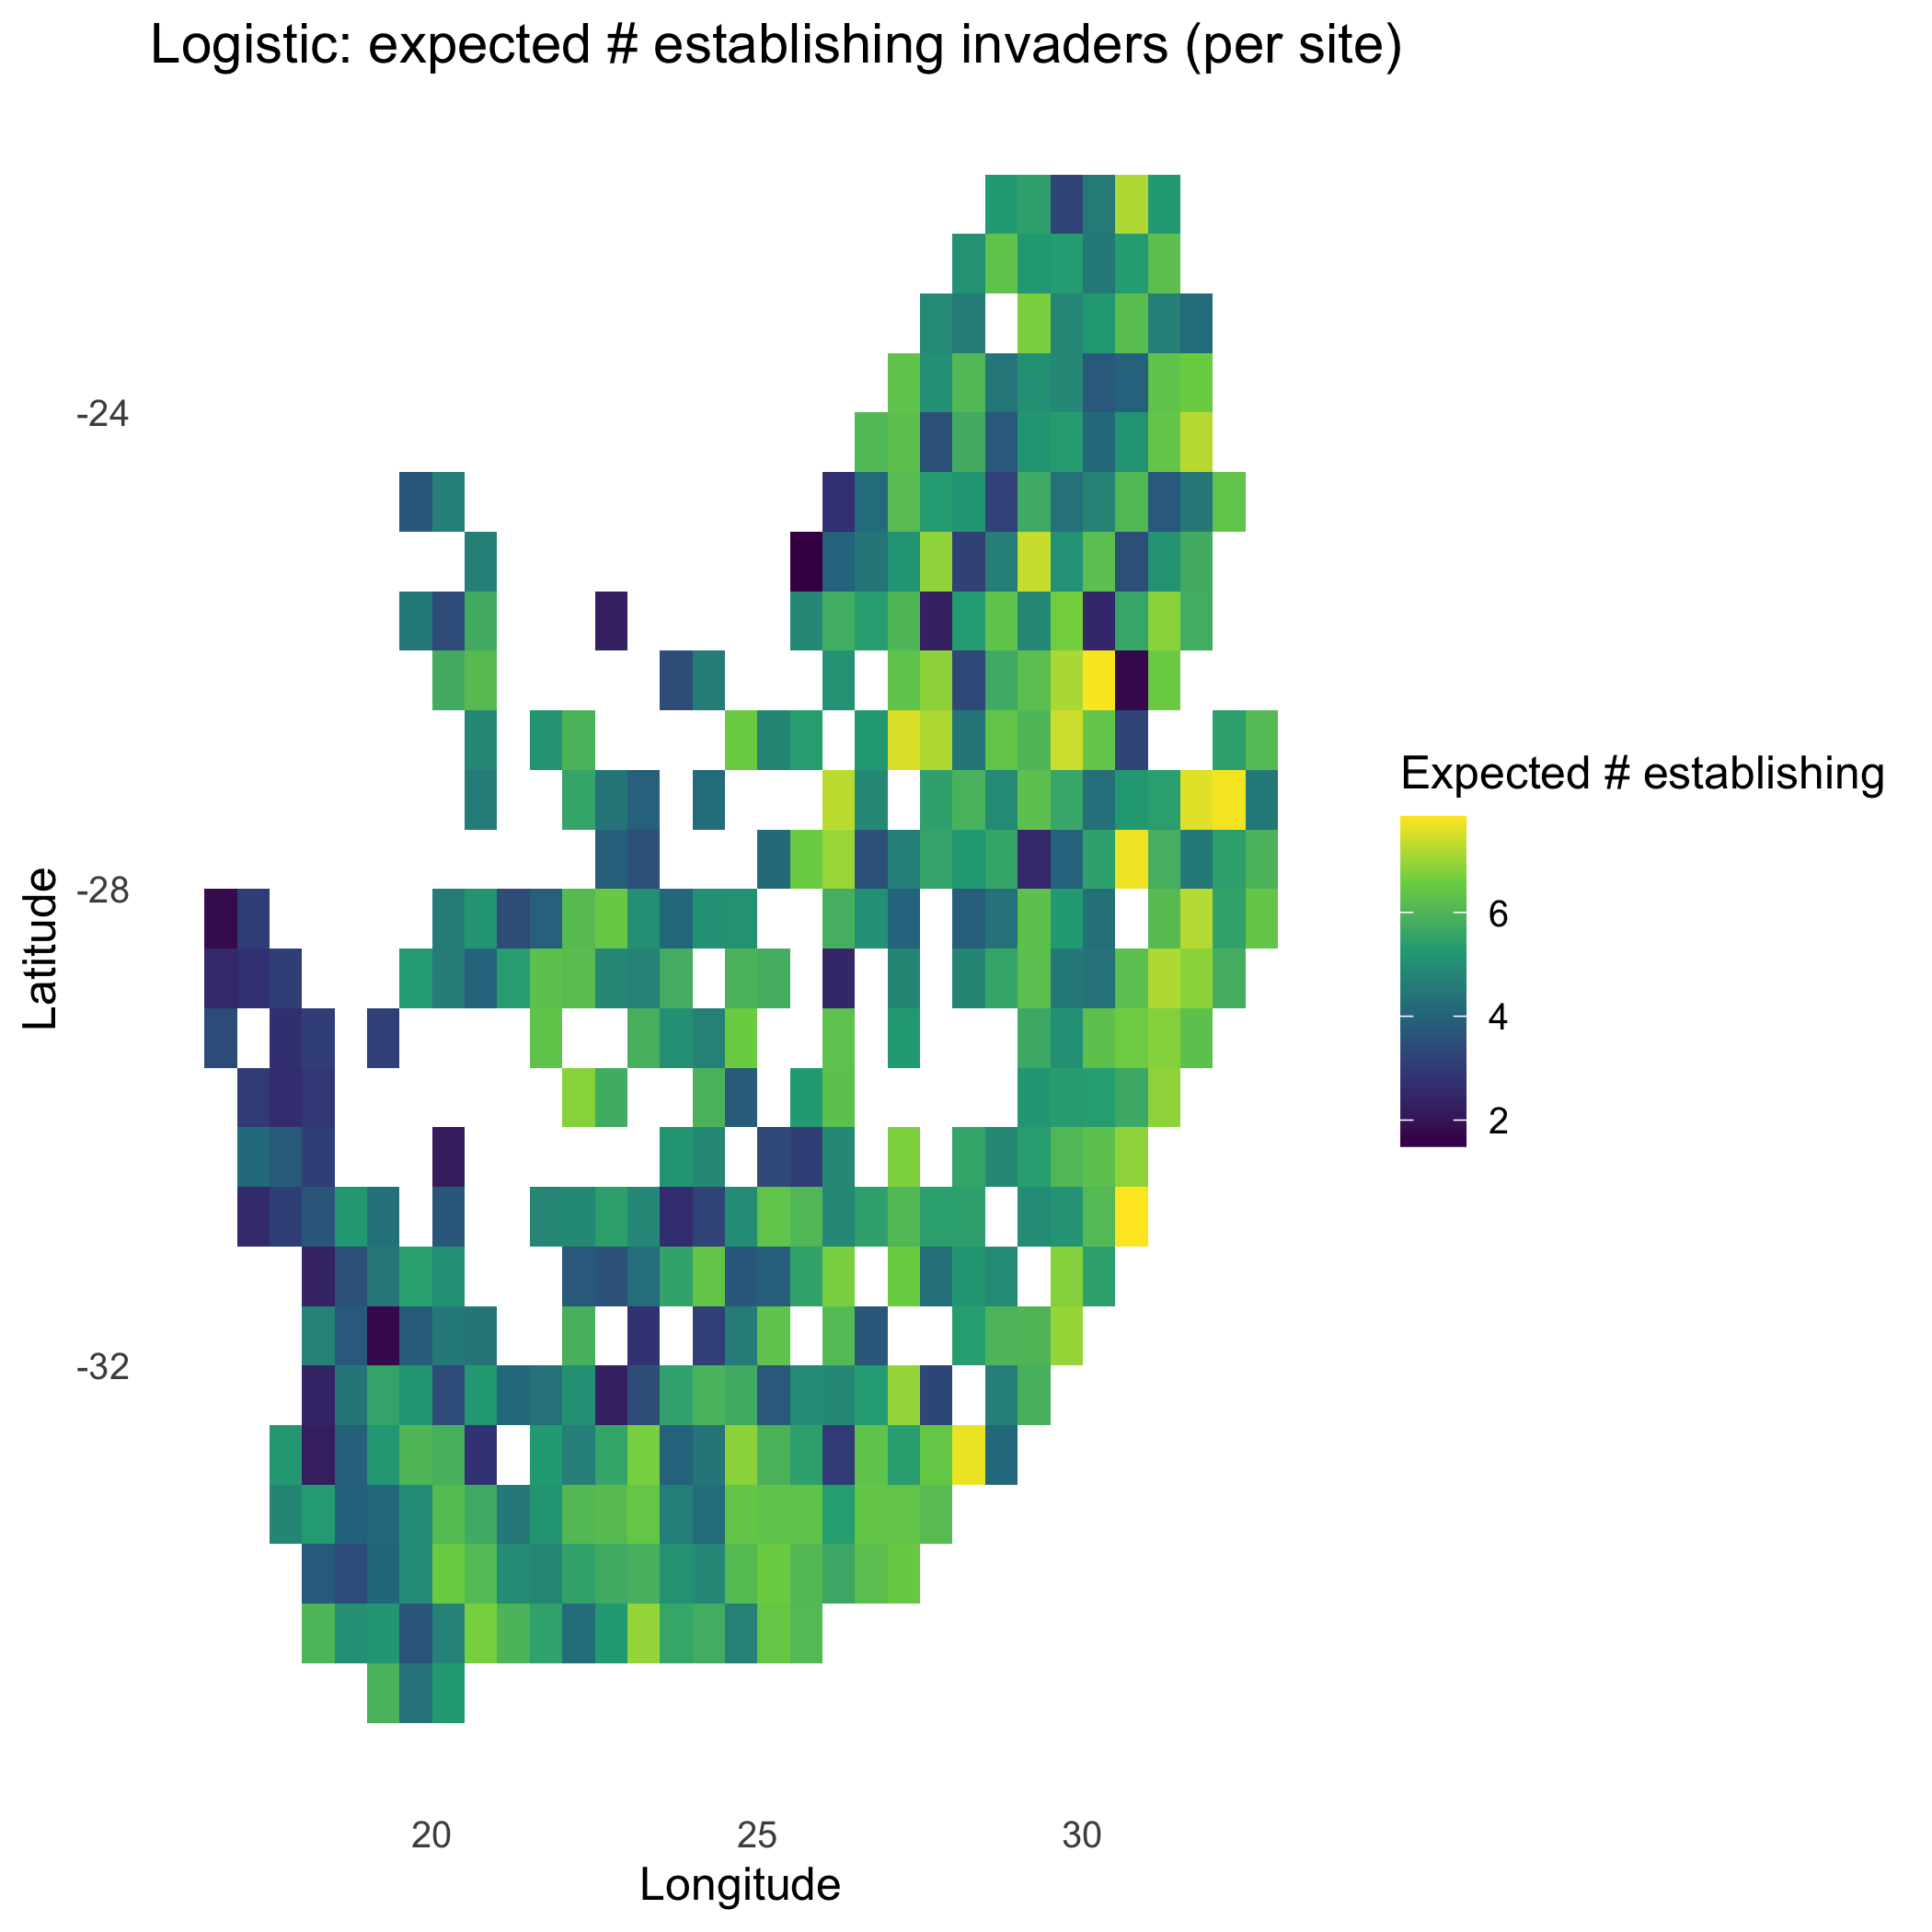
# ---- 4) Discrete “risk bands” (quintiles) for mean probability ---------------q = stats::quantile(p_site$mean_p, probs = seq(0,1,0.2), na.rm = TRUE)if (length(unique(q)) < 6L) {  q = seq(min(p_site$mean_p, na.rm = TRUE), max(p_site$mean_p, na.rm = TRUE), length.out = 6L)}p_site$band = cut(p_site$mean_p, breaks = q, include.lowest = TRUE,                   labels = c("very-low","low","medium","high","very-high"))
p_band = ggplot2::ggplot(p_site, ggplot2::aes(x = x, y = y, fill = band)) +  ggplot2::geom_tile() +  ggplot2::scale_fill_brewer(palette = "RdYlBu", direction = 1, name = "Site invasibility") +  ggplot2::labs(title = "Logistic: site invasibility bands (quintiles)",                x = "Longitude", y = "Latitude") +  ggplot2::theme_minimal(base_size = 12) +  ggplot2::theme(panel.grid = ggplot2::element_blank())if (exists("rsa")) p_band = p_band + ggplot2::geom_sf(data = rsa, inherit.aes = FALSE,                                                       fill = NA, color = "black", size = 0.3)print(p_band)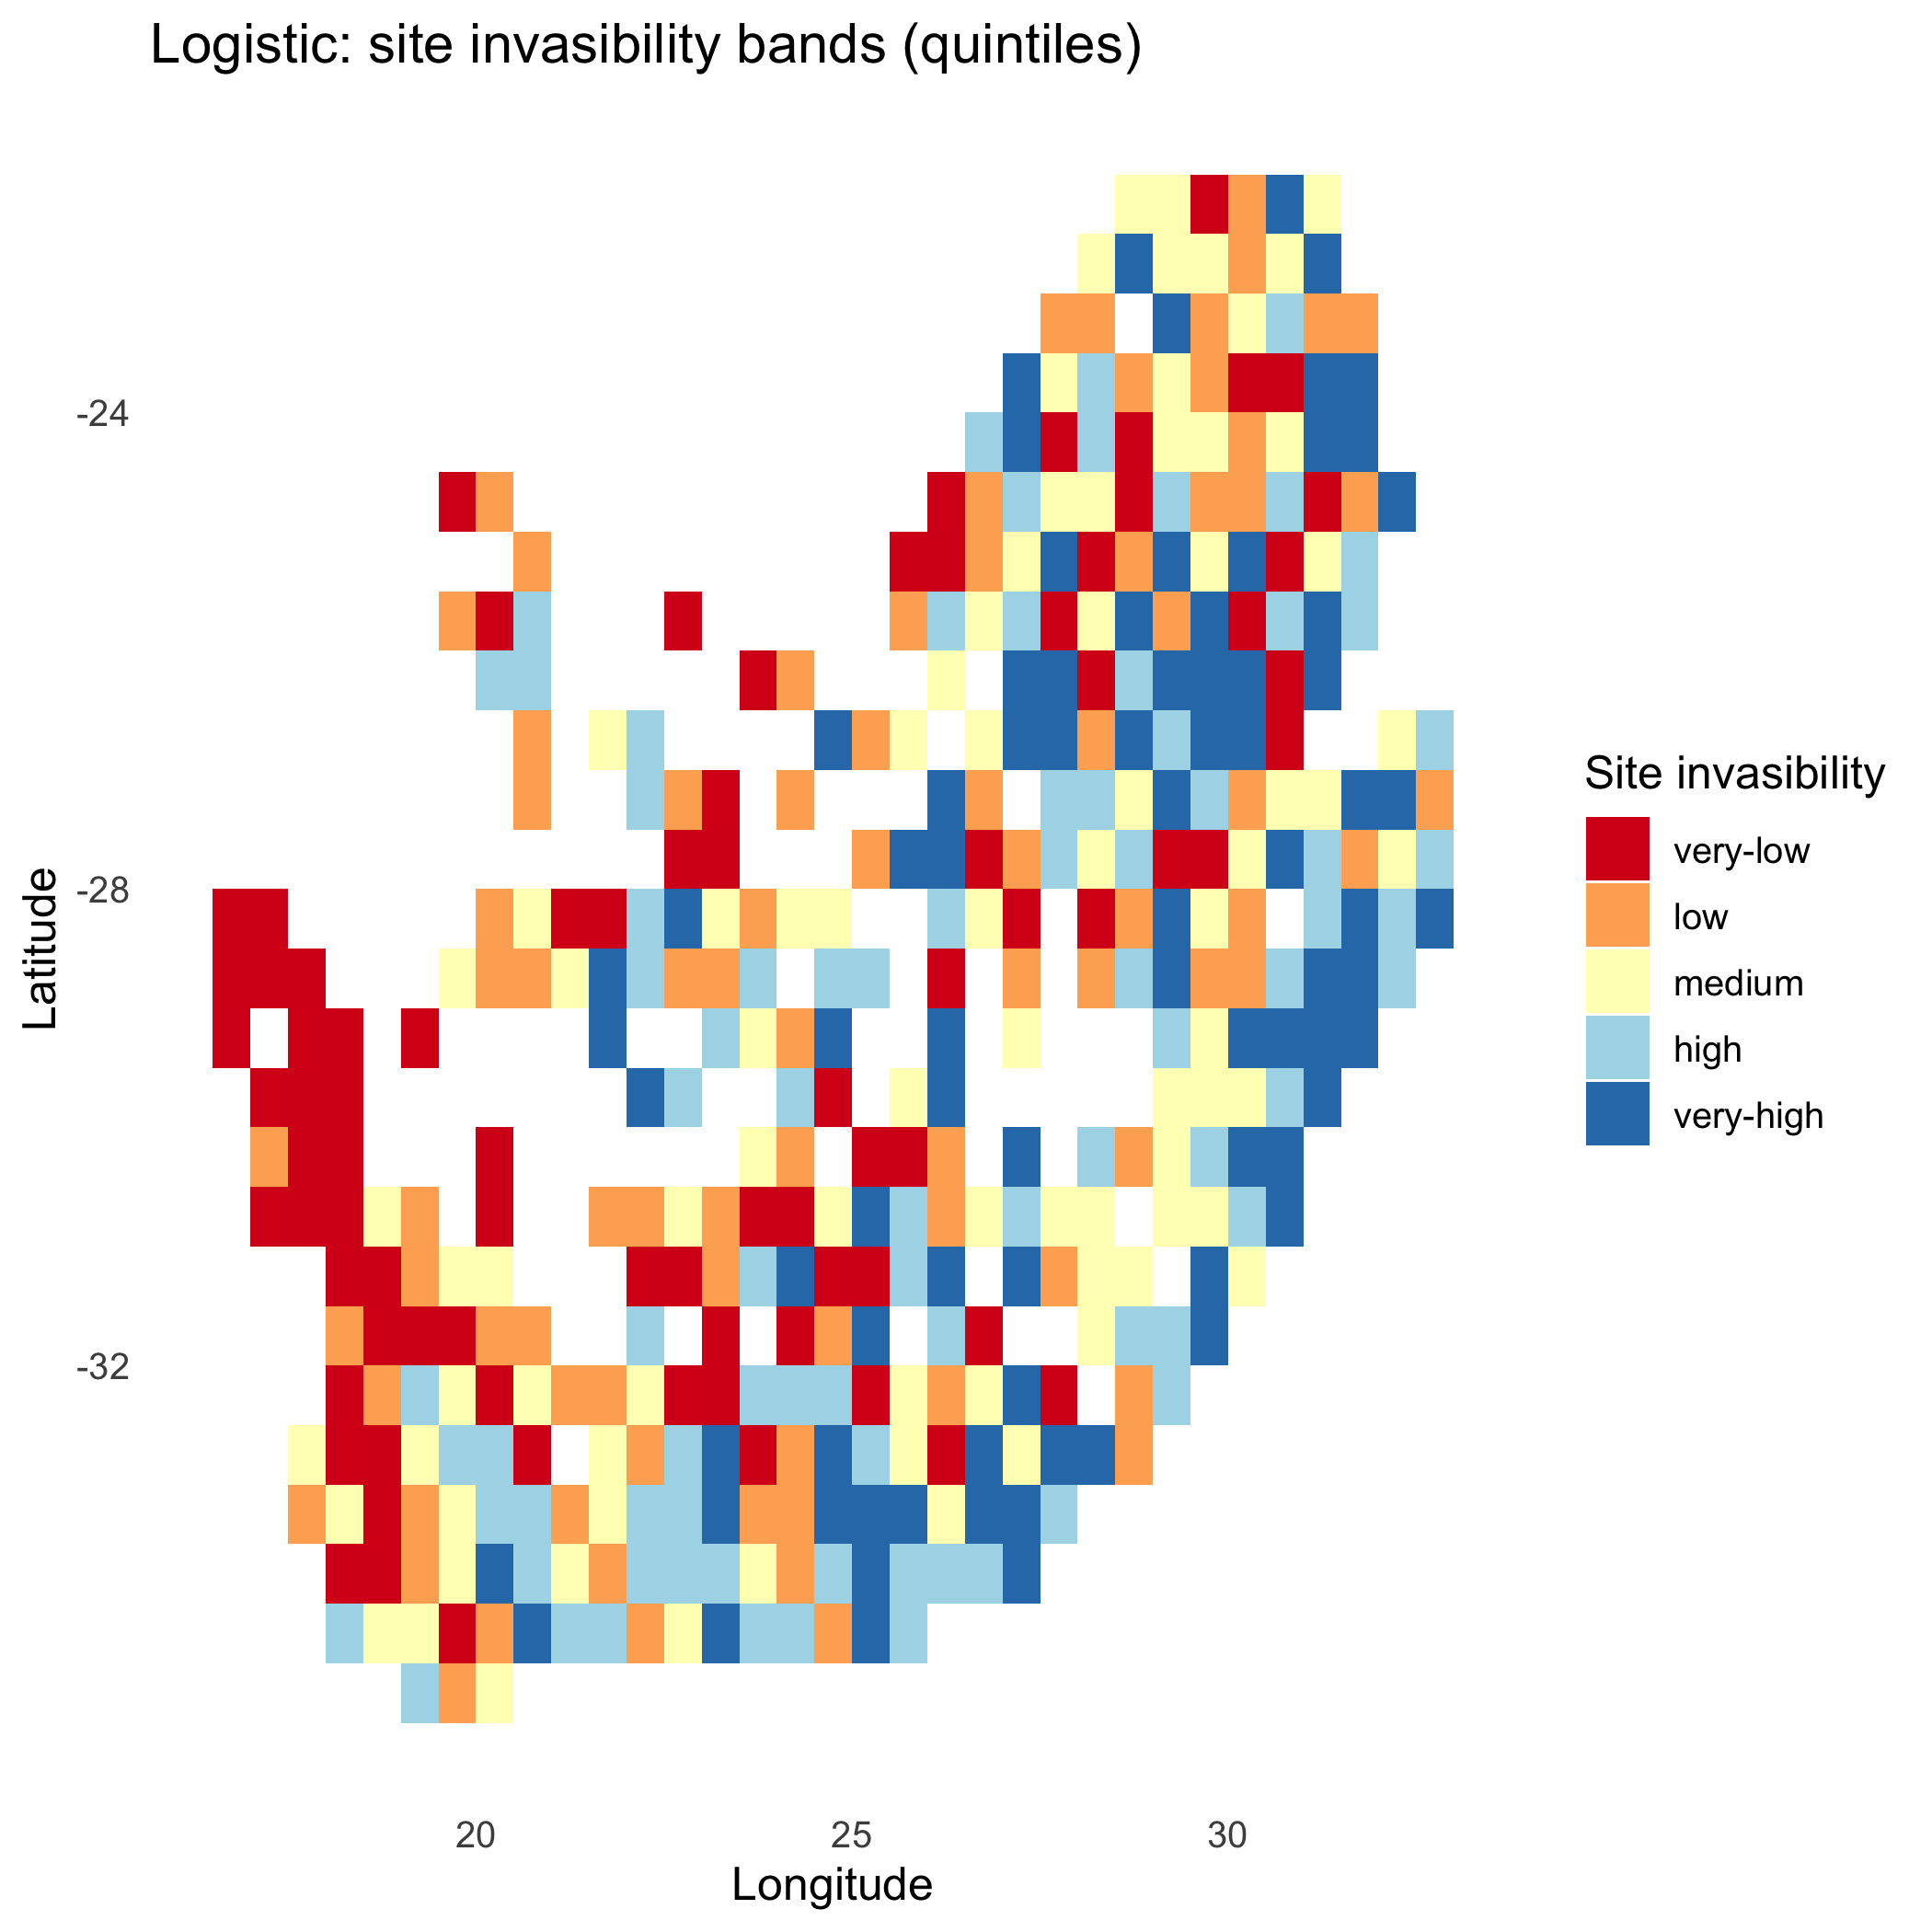
# ---- 5) Quick invader ranking ------------------------------------------------invader_rank = p_long |> dplyr::group_by(invader) |> dplyr::summarise(mean_p = mean(prob, na.rm = TRUE), .groups = "drop") |> dplyr::arrange(dplyr::desc(mean_p))print(head(invader_rank, 10))#> # A tibble: 10 × 2#> invader mean_p#> <chr> <dbl>#> 1 inv5 0.532#> 2 inv10 0.530#> 3 inv6 0.529#> 4 inv7 0.523#> 5 inv4 0.519#> 6 inv9 0.516#> 7 inv8 0.511#> 8 inv3 0.498#> 9 inv1 0.478#> 10 inv2 0.474:chart_with_upwards_trend: Figure 7: Logistic-linked establishment probabilities with
. Spatial gradients resemble the probit view but with logistic tails; tuning shifts the steepness of transitions around .
:bulb: Interpretation: Tune
Method C: Hard rule
Section titled “Method C: Hard rule ”A crisp decision surface for thresholded planning and auditing.
library(ggplot2)outH = invasimapr::compute_establishment_probability( r_is_z, C_is_z, S_is_z, gamma = gamma, alpha = alpha, beta = beta, method = "hard", site_df = site_df, return_long = TRUE, make_plots = TRUE)str(outH, 1)#> List of 7#> $ p_is : int [1:415, 1:10] 0 0 1 1 0 0 1 1 0 1 ...#> ..- attr(*, "dimnames")=List of 2#> $ lambda_is : num [1:415, 1:10] -0.821 -2.265 0.239 1.209 -0.318 ...#> ..- attr(*, "dimnames")=List of 2#> $ sigma_used : NULL#> $ method : chr "hard"#> $ option_label: chr "hard"#> $ prob_long : tibble [4,150 × 7] (S3: tbl_df/tbl/data.frame)#> $ plots :List of 3:bar_chart: Imposes a deterministic threshold
# Build probability long table (0/1 under hard rule)p_long = if (!is.null(outH$p_long)) {  outH$p_long} else if (!is.null(outH$prob_long)) {  outH$prob_long} else if (!is.null(outH$lambda_long)) {  dplyr::mutate(outH$lambda_long, p = as.numeric(lambda > 0))} else stop("No probability table found in outH.")p_long = p_long |>  dplyr::rename(prob = dplyr::any_of(c("p","prob","probability","val"))) |>  dplyr::select(site, invader, prob) |>  dplyr::mutate(site = as.character(site), invader = as.character(invader))
# ---- Site summaries: COUNT and PERCENT ---------------------------------------site_sum = p_long |>  dplyr::group_by(site) |>  dplyr::summarise(    n_est   = as.integer(sum(prob, na.rm = TRUE)),      # whole-number count    n_eval  = sum(!is.na(prob)),                         # how many invaders evaluated    frac    = ifelse(n_eval > 0, n_est / n_eval, NA_real_) # percent basis (0..1)  ) |>  dplyr::left_join(site_df, by = "site")
# ---- Map 1: COUNT of establishing invaders ($\lambda$>0) ------------------------------p_count = ggplot2::ggplot(site_sum, ggplot2::aes(x = x, y = y, fill = n_est)) +  ggplot2::geom_tile() +  ggplot2::scale_fill_viridis_c(name = "Count (\u03BB>0)",                                labels = function(x) formatC(x, digits = 0, format = "f")) +  ggplot2::labs(title = "Hard rule: count of establishing invaders per site",                x = "Longitude", y = "Latitude") +  ggplot2::theme_minimal(base_size = 12) +  ggplot2::theme(panel.grid = ggplot2::element_blank())if (exists("rsa")) p_count = p_count +  ggplot2::geom_sf(data = rsa, inherit.aes = FALSE, fill = NA, color = "black", size = 0.3)print(p_count)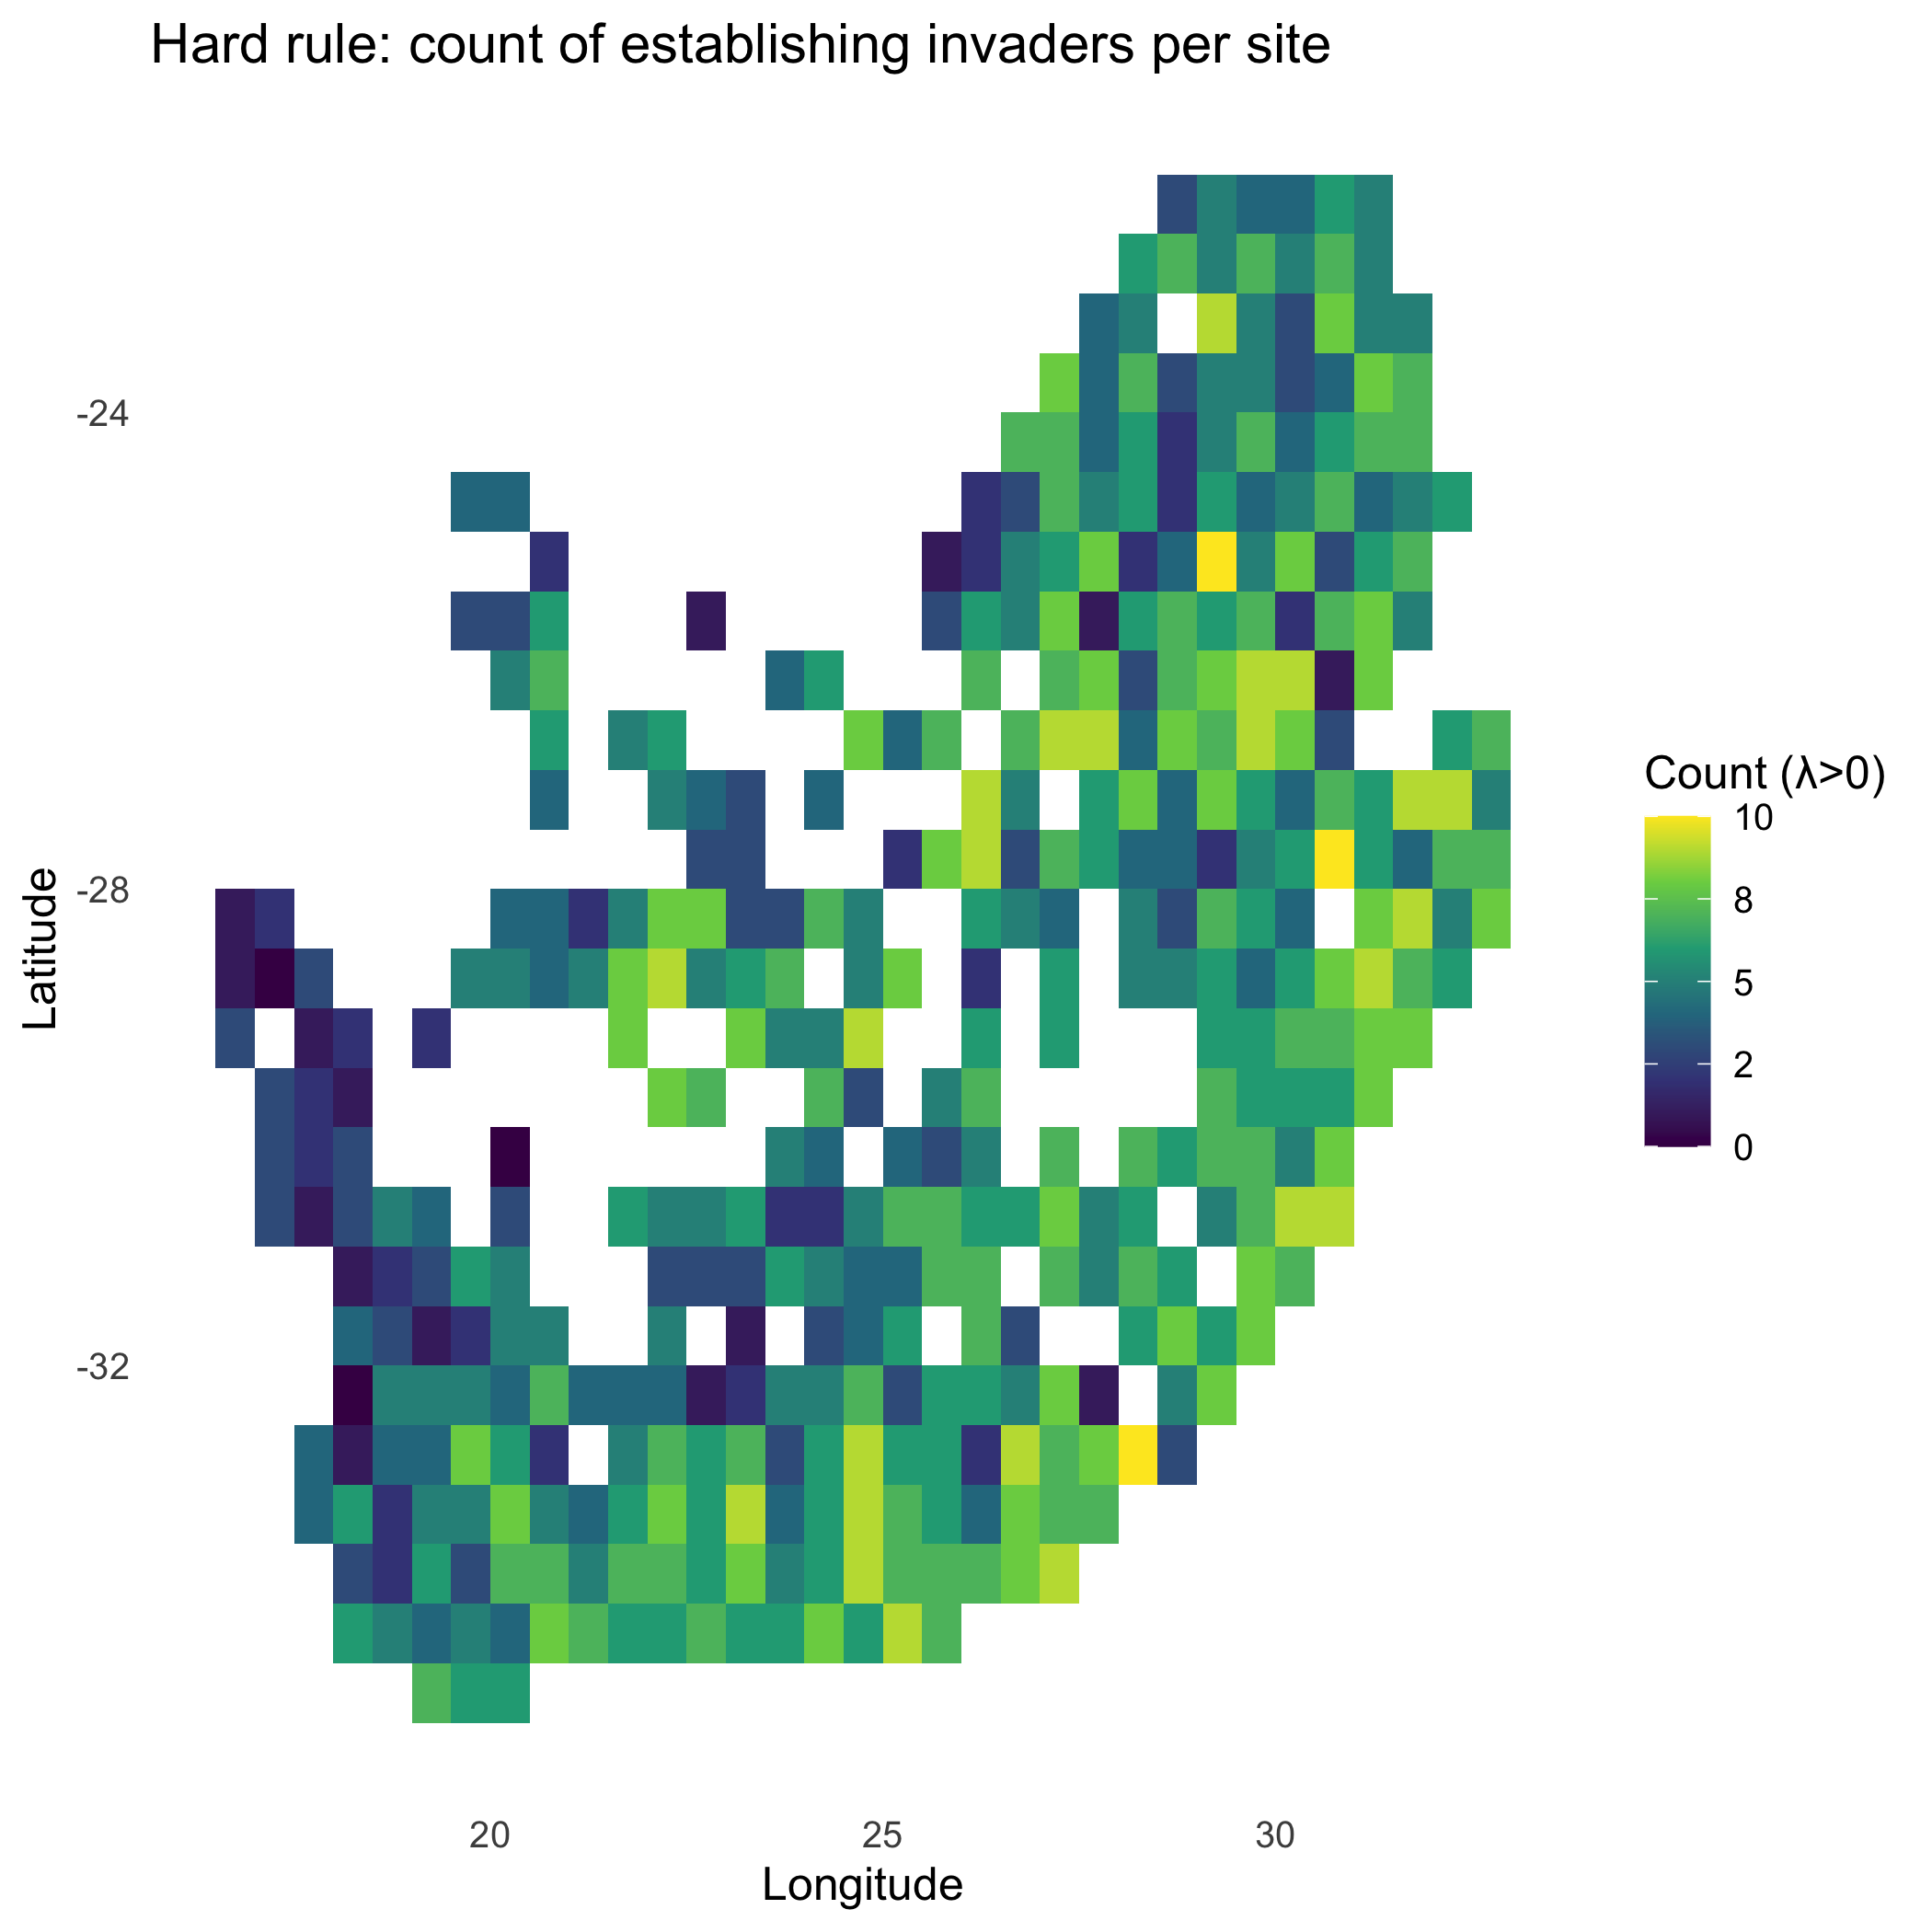
# ---- Map 2: PERCENT of invaders establishing ($\lambda$>0) ----------------------------p_percent = ggplot2::ggplot(site_sum, ggplot2::aes(x = x, y = y, fill = frac)) + ggplot2::geom_tile() + ggplot2::scale_fill_viridis_c(name = "% establishing", limits = c(0,1), labels = scales::percent_format(accuracy = 1)) + ggplot2::labs(title = "Hard rule: percent of invaders establishing per site", x = "Longitude", y = "Latitude") + ggplot2::theme_minimal(base_size = 12) + ggplot2::theme(panel.grid = ggplot2::element_blank())if (exists("rsa")) p_percent = p_percent + ggplot2::geom_sf(data = rsa, inherit.aes = FALSE, fill = NA, color = "black", size = 0.3)print(p_percent)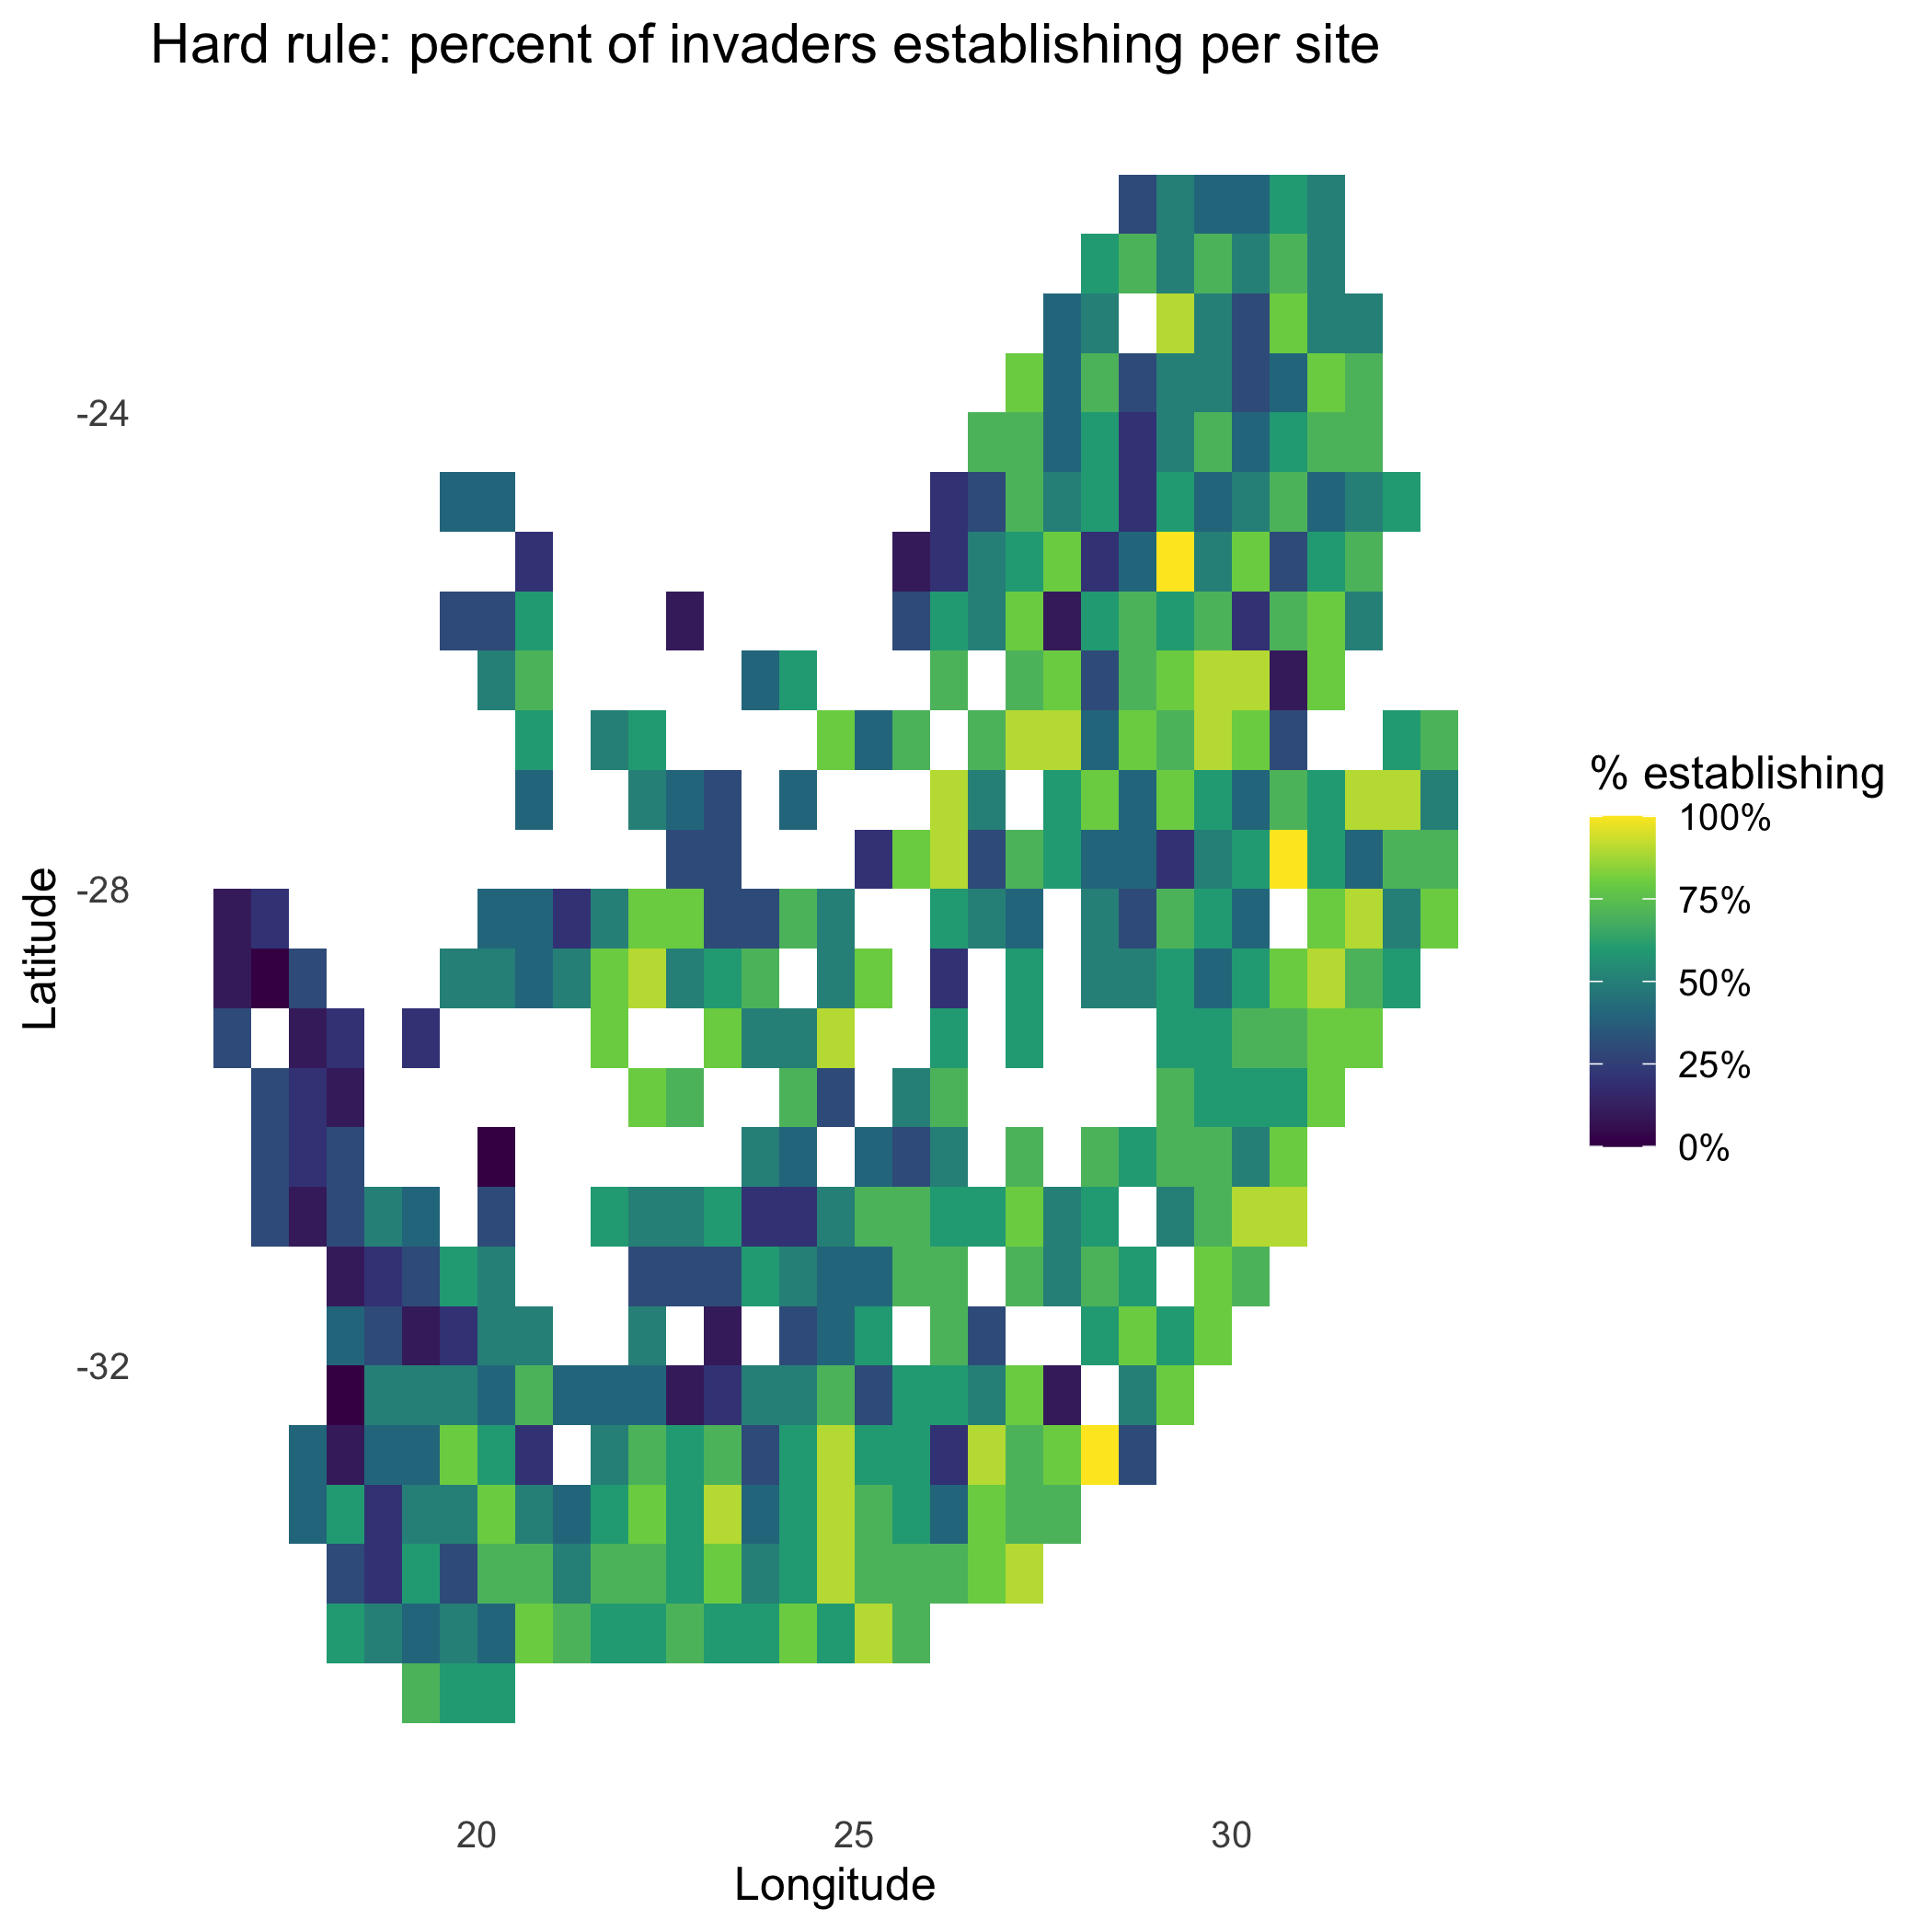
# ---- Optional: discrete quintile bands on % (communication-friendly) ----------q = stats::quantile(site_sum$frac, probs = seq(0,1,0.2), na.rm = TRUE)if (length(unique(q)) < 6L) {  # fallback if ties collapse bins  q = seq(min(site_sum$frac, na.rm = TRUE), max(site_sum$frac, na.rm = TRUE), length.out = 6L)}site_sum$band = cut(site_sum$frac, breaks = q, include.lowest = TRUE,                     labels = c("very-low","low","medium","high","very-high"))
p_bands = ggplot2::ggplot(site_sum, ggplot2::aes(x = x, y = y, fill = band)) +  ggplot2::geom_tile() +  ggplot2::scale_fill_brewer(palette = "RdYlBu", direction = 1, name = "Site invasibility") +  ggplot2::labs(title = "Hard rule: invasibility bands (quintiles of % establishing)",                x = "Longitude", y = "Latitude") +  ggplot2::theme_minimal(base_size = 12) +  ggplot2::theme(panel.grid = ggplot2::element_blank())if (exists("rsa")) p_bands = p_bands +  ggplot2::geom_sf(data = rsa, inherit.aes = FALSE, fill = NA, color = "black", size = 0.3)print(p_bands)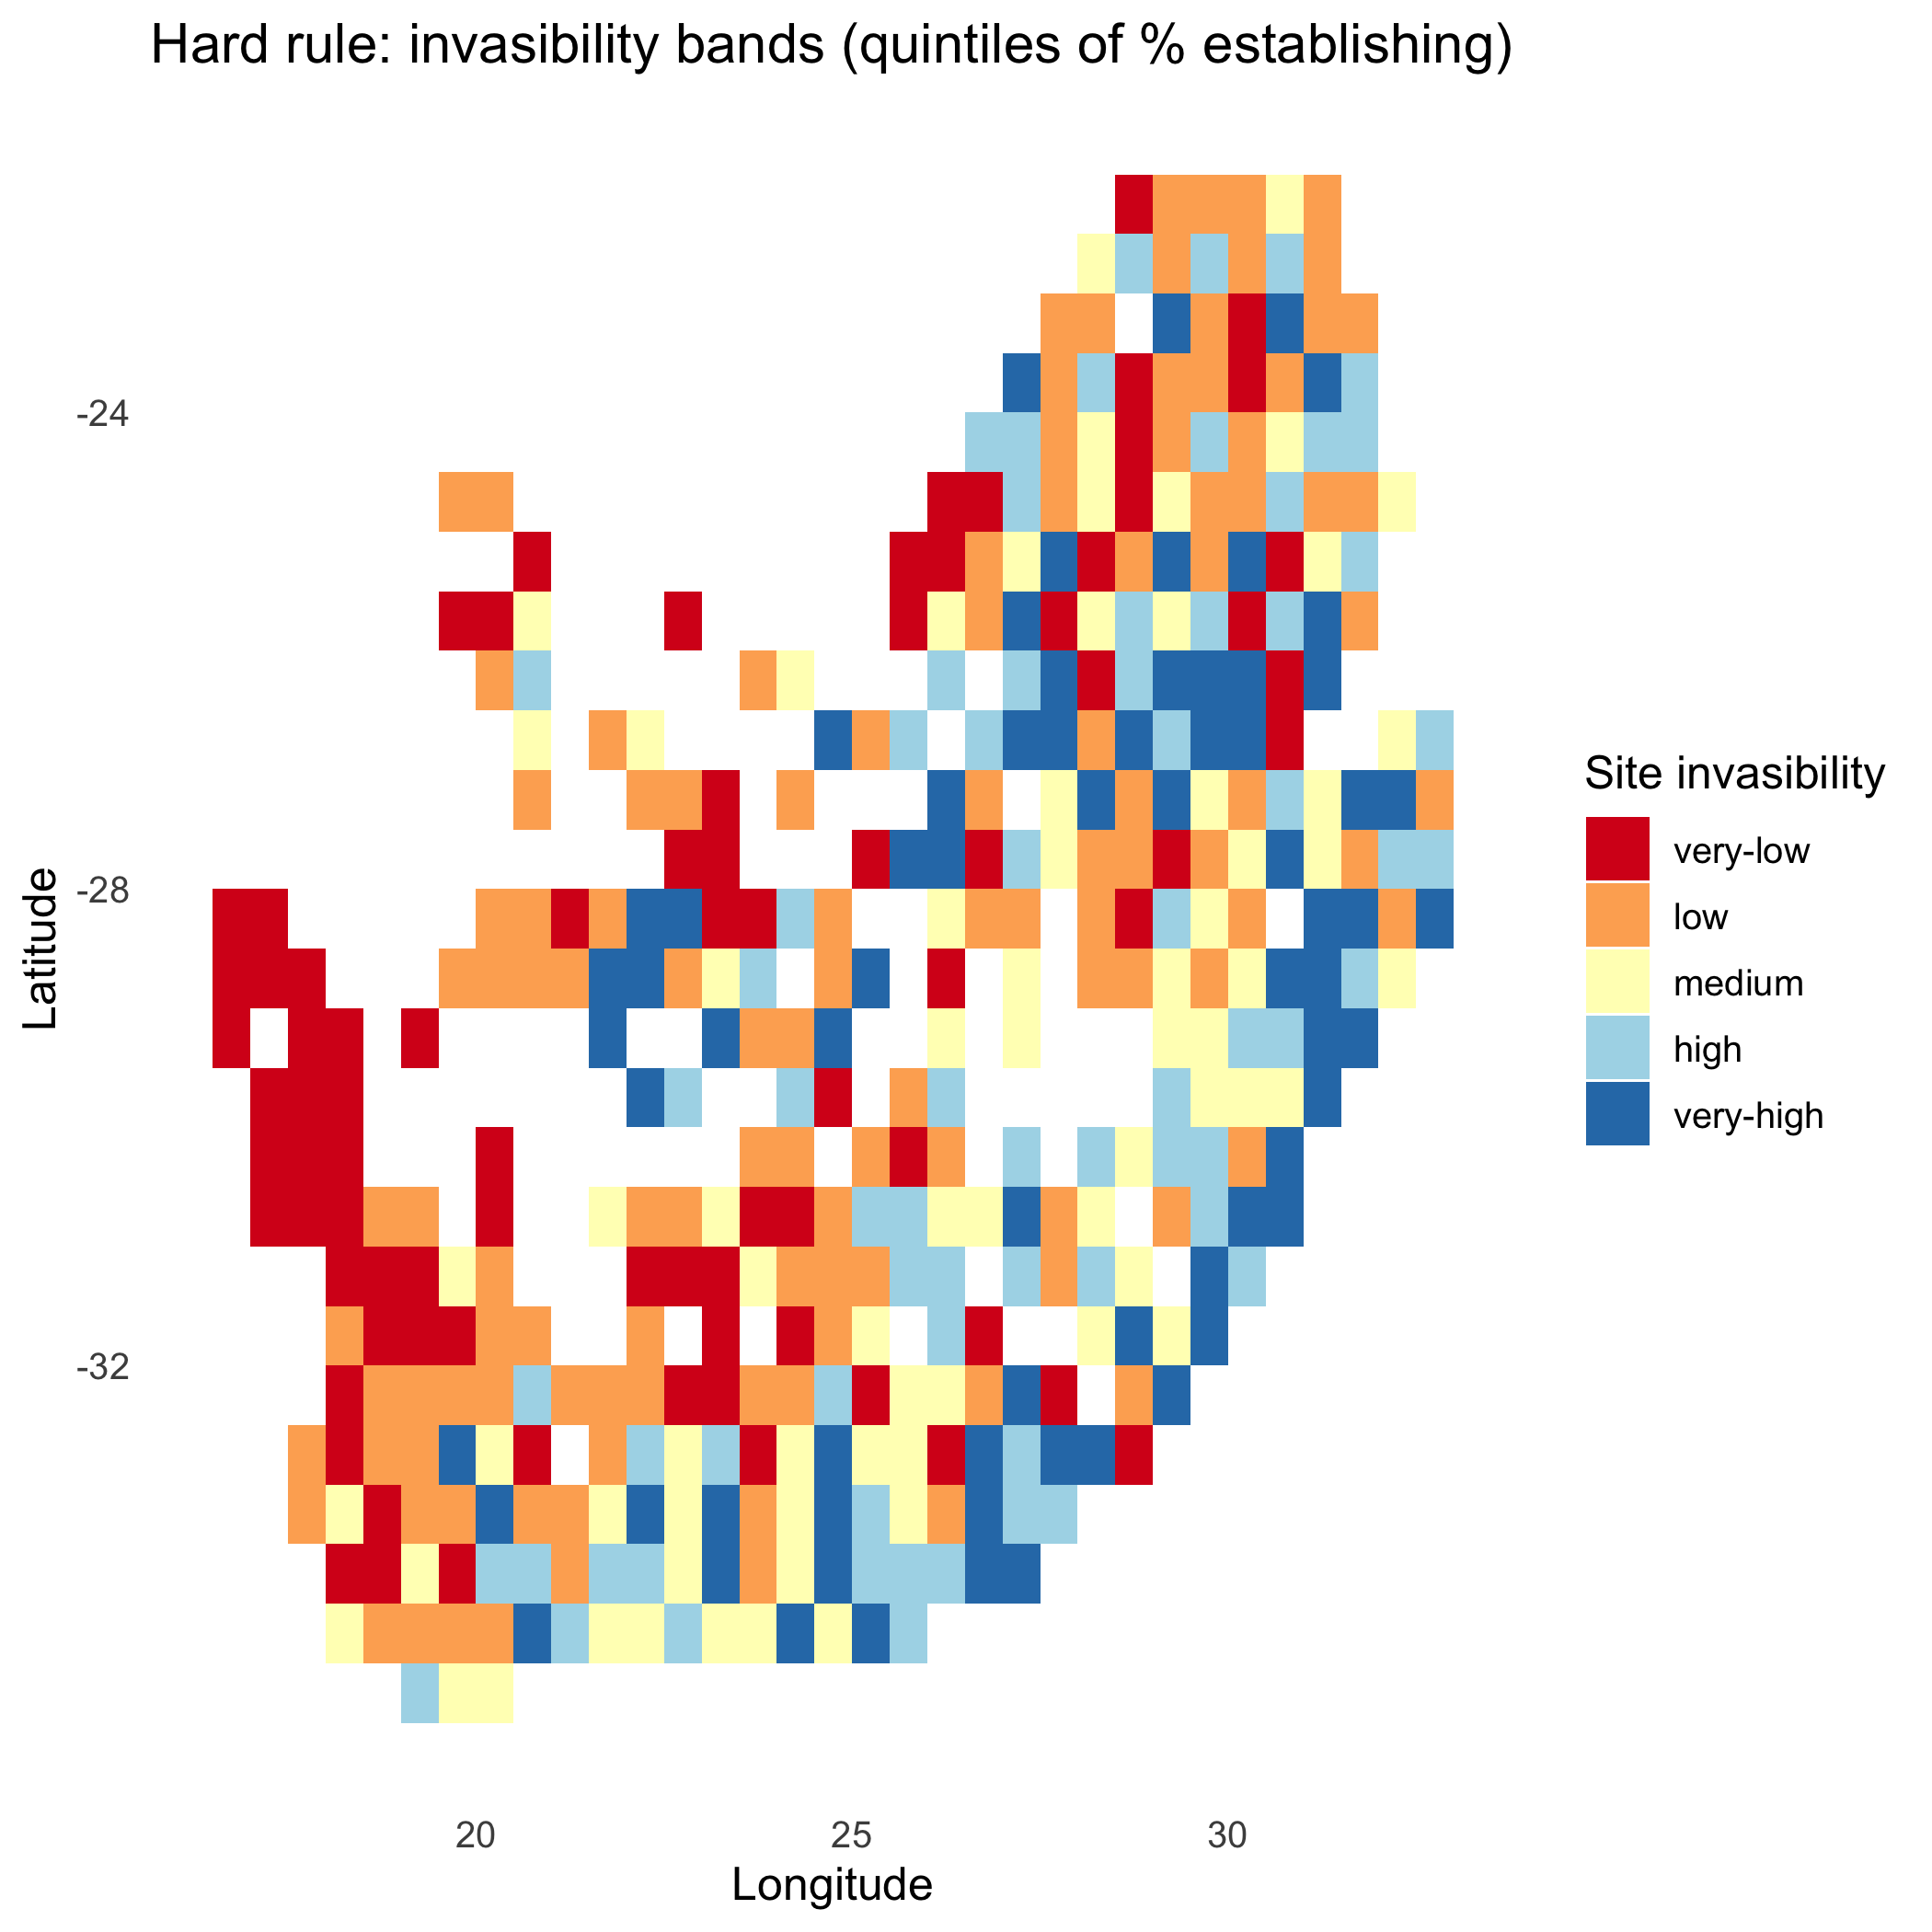
# ---- Invader ranking as % of sites (not mean) ---------------------------------invader_rank = p_long |> dplyr::group_by(invader) |> dplyr::summarise(pct_sites = mean(prob, na.rm = TRUE)) |> dplyr::mutate(pct_sites = scales::percent(pct_sites, accuracy = 1)) |> dplyr::arrange(dplyr::desc(pct_sites))print(invader_rank)#> # A tibble: 10 × 2#> invader pct_sites#> <chr> <chr>#> 1 inv10 59%#> 2 inv5 59%#> 3 inv7 58%#> 4 inv4 55%#> 5 inv6 55%#> 6 inv8 55%#> 7 inv9 54%#> 8 inv3 53%#> 9 inv1 48%#> 10 inv2 48%:chart_with_upwards_trend: Figure 8: Binary establishment under a hard threshold. Count and percent maps identify sites prone to establishment by many invaders; rankings report the breadth of each invader’s spatial viability.
:bulb: Interpretation: Pair a count map (# invaders establishing per site) with per-invader 0/1 facets for rapid triage.
Method D: Probit with predictive SD (uncertainty-aware)
Section titled “Method D: Probit with predictive SD (uncertainty-aware)”Use cell-wise predictive SD combining fixed-effect uncertainty (from vcov) and residual noise so that low-information regions shrink toward 0.5.
Q_inv = fit$traits$Q_inv# Build a sigma matrix from your auxiliary GLMMsigma_mat = sigma_mat_from_vcov(  fit   = fit$sensitivities$fit_coeffs,                     # GLMM on r_z, C_z, S_z × trait-plane terms  r_is_z = r_is_z, C_is_z = C_is_z, S_is_z = S_is_z,  Q_inv  = Q_inv,  add_resid = TRUE                     # predictive SD, not just mean-SE)
outPSD = invasimapr::compute_establishment_probability(  r_is_z, C_is_z, S_is_z,  gamma = gamma, alpha = alpha, beta = beta,  method = "probit",  predictive = TRUE, sigma_mat = sigma_mat,  site_df = site_df, return_long = TRUE, make_plots = TRUE,  option_label = "Probit (predictive SD)")str(outPSD, 1)#> List of 7#>  $ p_is        : num [1:415, 1:10] 0.128158 0.000921 0.629142 0.952504 0.330739 ...#>   ..- attr(*, "dimnames")=List of 2#>  $ lambda_is   : num [1:415, 1:10] -0.821 -2.265 0.239 1.209 -0.318 ...#>   ..- attr(*, "dimnames")=List of 2#>  $ sigma_used  : num [1:415, 1:10] 0.724 0.727 0.724 0.724 0.726 ...#>   ..- attr(*, "dimnames")=List of 2#>  $ method      : chr "probit"#>  $ option_label: chr "Probit (predictive SD)"#>  $ prob_long   : tibble [4,150 × 7] (S3: tbl_df/tbl/data.frame)#>  $ plots       :List of 3
:bar_chart: Displays (i) site-mean probability incorporating predictive SD, (ii) a map of the site-mean predictive SD to localise uncertainty, and (iii) the distribution of
`%||%` = function(a, b) if (!is.null(a)) a else b
# ---- Prepare long probability table ------------------------------------------p_long = if (!is.null(outPSD$prob_long)) outPSD$prob_long else outPSD$p_longstopifnot(!is.null(p_long))p_long = p_long |>  dplyr::select(site, invader, val, x, y) |>  dplyr::mutate(site = as.character(site), invader = as.character(invader))
# ---- Site-mean probability map ------------------------------------------------site_mean = p_long |>  dplyr::group_by(site, x, y) |>  dplyr::summarise(p_mean = mean(val, na.rm = TRUE), .groups = "drop")
p_site = ggplot2::ggplot(site_mean, ggplot2::aes(x = x, y = y, fill = p_mean)) +  ggplot2::geom_tile() +  ggplot2::scale_fill_viridis_c(name = "Mean P(estab.)", limits = c(0,1)) +  ggplot2::labs(title = "Probit (predictive SD): site-mean establishment probability",                x = "Longitude", y = "Latitude") +  ggplot2::theme_minimal(base_size = 12) +  ggplot2::theme(panel.grid = ggplot2::element_blank())if (exists("rsa")) p_site = p_site +  ggplot2::geom_sf(data = rsa, inherit.aes = FALSE, fill = NA, color = "black", size = 0.35)print(p_site)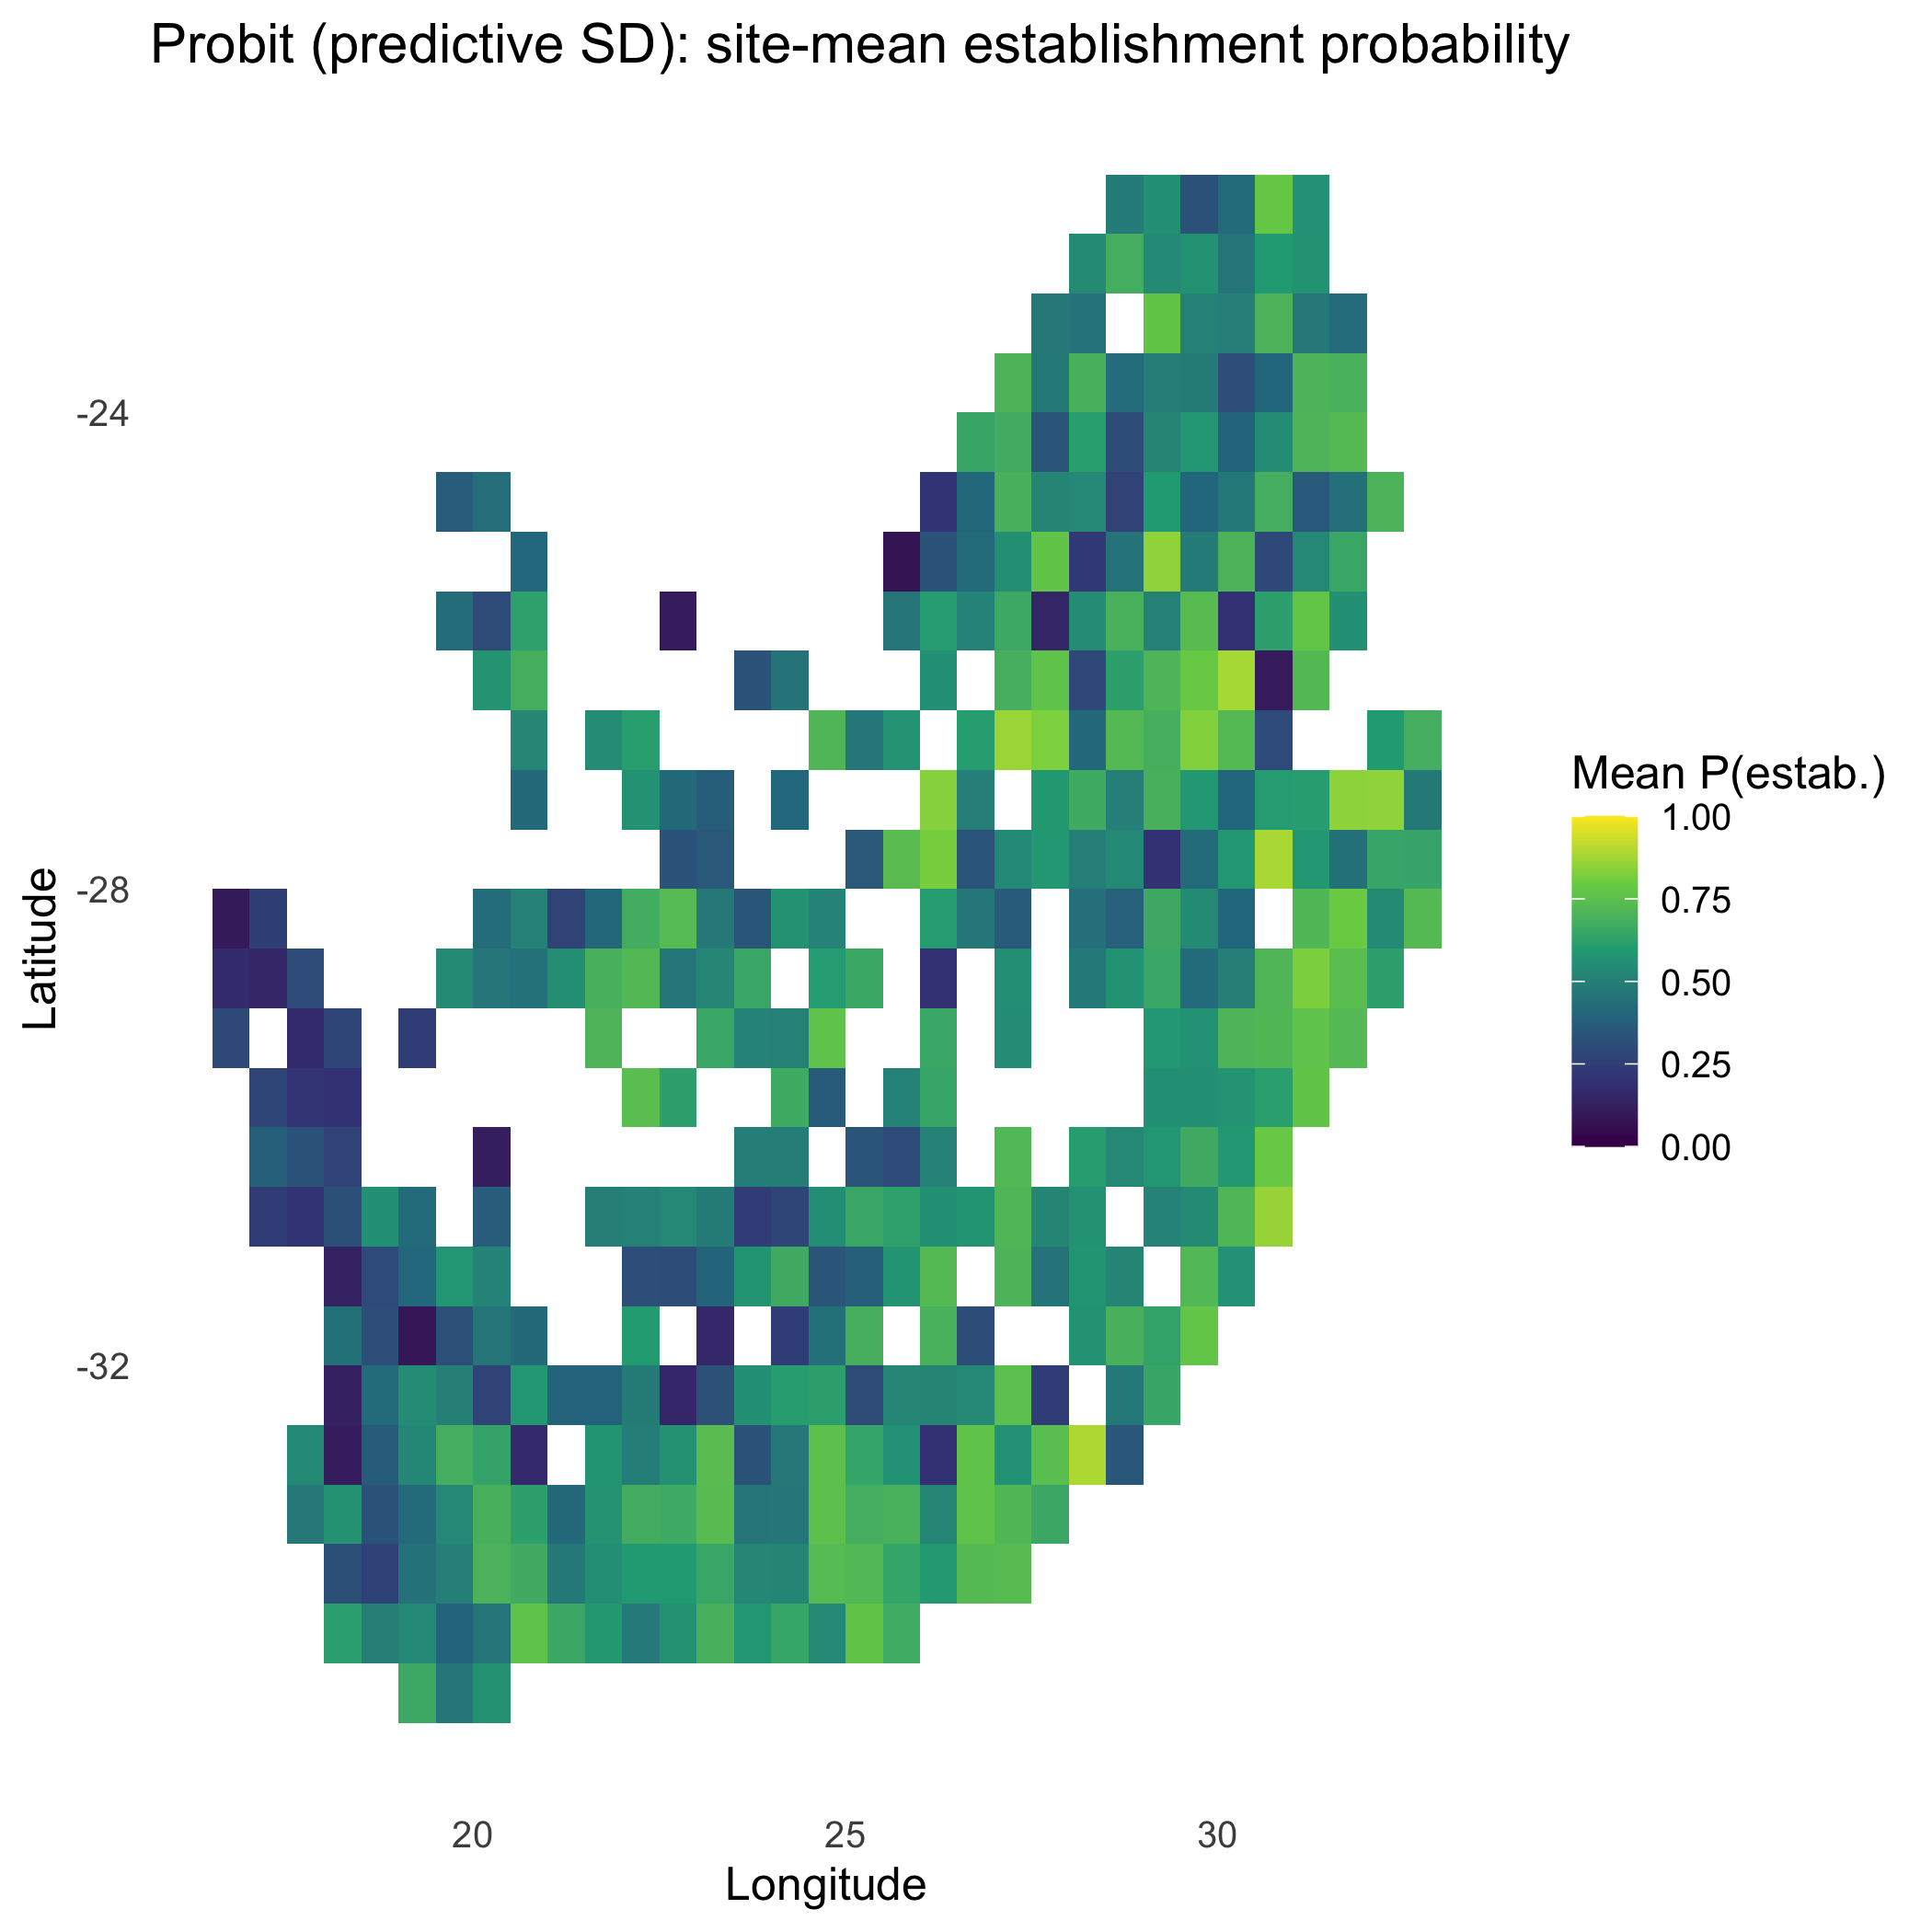
# ---- Uncertainty map: site-mean predictive SD (σ) -----------------------------# ---- Build site-mean predictive SD (σ) safely --------------------------------stopifnot(exists("sigma_mat"), exists("site_df"))site_ids = as.character(site_df$site)
# Decide whether sites are in rows or columnssites_are_rows = !is.null(rownames(sigma_mat)) &&  mean(rownames(sigma_mat) %in% site_ids) > 0.5sites_are_cols = !is.null(colnames(sigma_mat)) &&  mean(colnames(sigma_mat) %in% site_ids) > 0.5
if (sites_are_rows) {  sigma_df = data.frame(    site       = rownames(sigma_mat),    sigma_mean = rowMeans(sigma_mat, na.rm = TRUE),    row.names  = NULL,    check.names = FALSE  )} else if (sites_are_cols) {  sigma_df = data.frame(    site       = colnames(sigma_mat),    sigma_mean = colMeans(sigma_mat, na.rm = TRUE),    row.names  = NULL,    check.names = FALSE  )} else {  stop("Could not match site IDs to sigma_mat rownames/colnames.")}
sigma_df = sigma_df |>  dplyr::mutate(site = as.character(site)) |>  dplyr::left_join(site_df, by = "site")
# ---- Plot the uncertainty map -------------------------------------------------p_sigma = ggplot2::ggplot(sigma_df, ggplot2::aes(x = x, y = y, fill = sigma_mean)) +  ggplot2::geom_tile() +  ggplot2::scale_fill_viridis_c(name = "Predictive SD (σ)") +  ggplot2::labs(title = "Uncertainty map: site-mean predictive SD",                x = "Longitude", y = "Latitude") +  ggplot2::theme_minimal(base_size = 12) +  ggplot2::theme(panel.grid = ggplot2::element_blank())if (exists("rsa")) p_sigma = p_sigma +  ggplot2::geom_sf(data = rsa, inherit.aes = FALSE, fill = NA, color = "black", size = 0.35)print(p_sigma)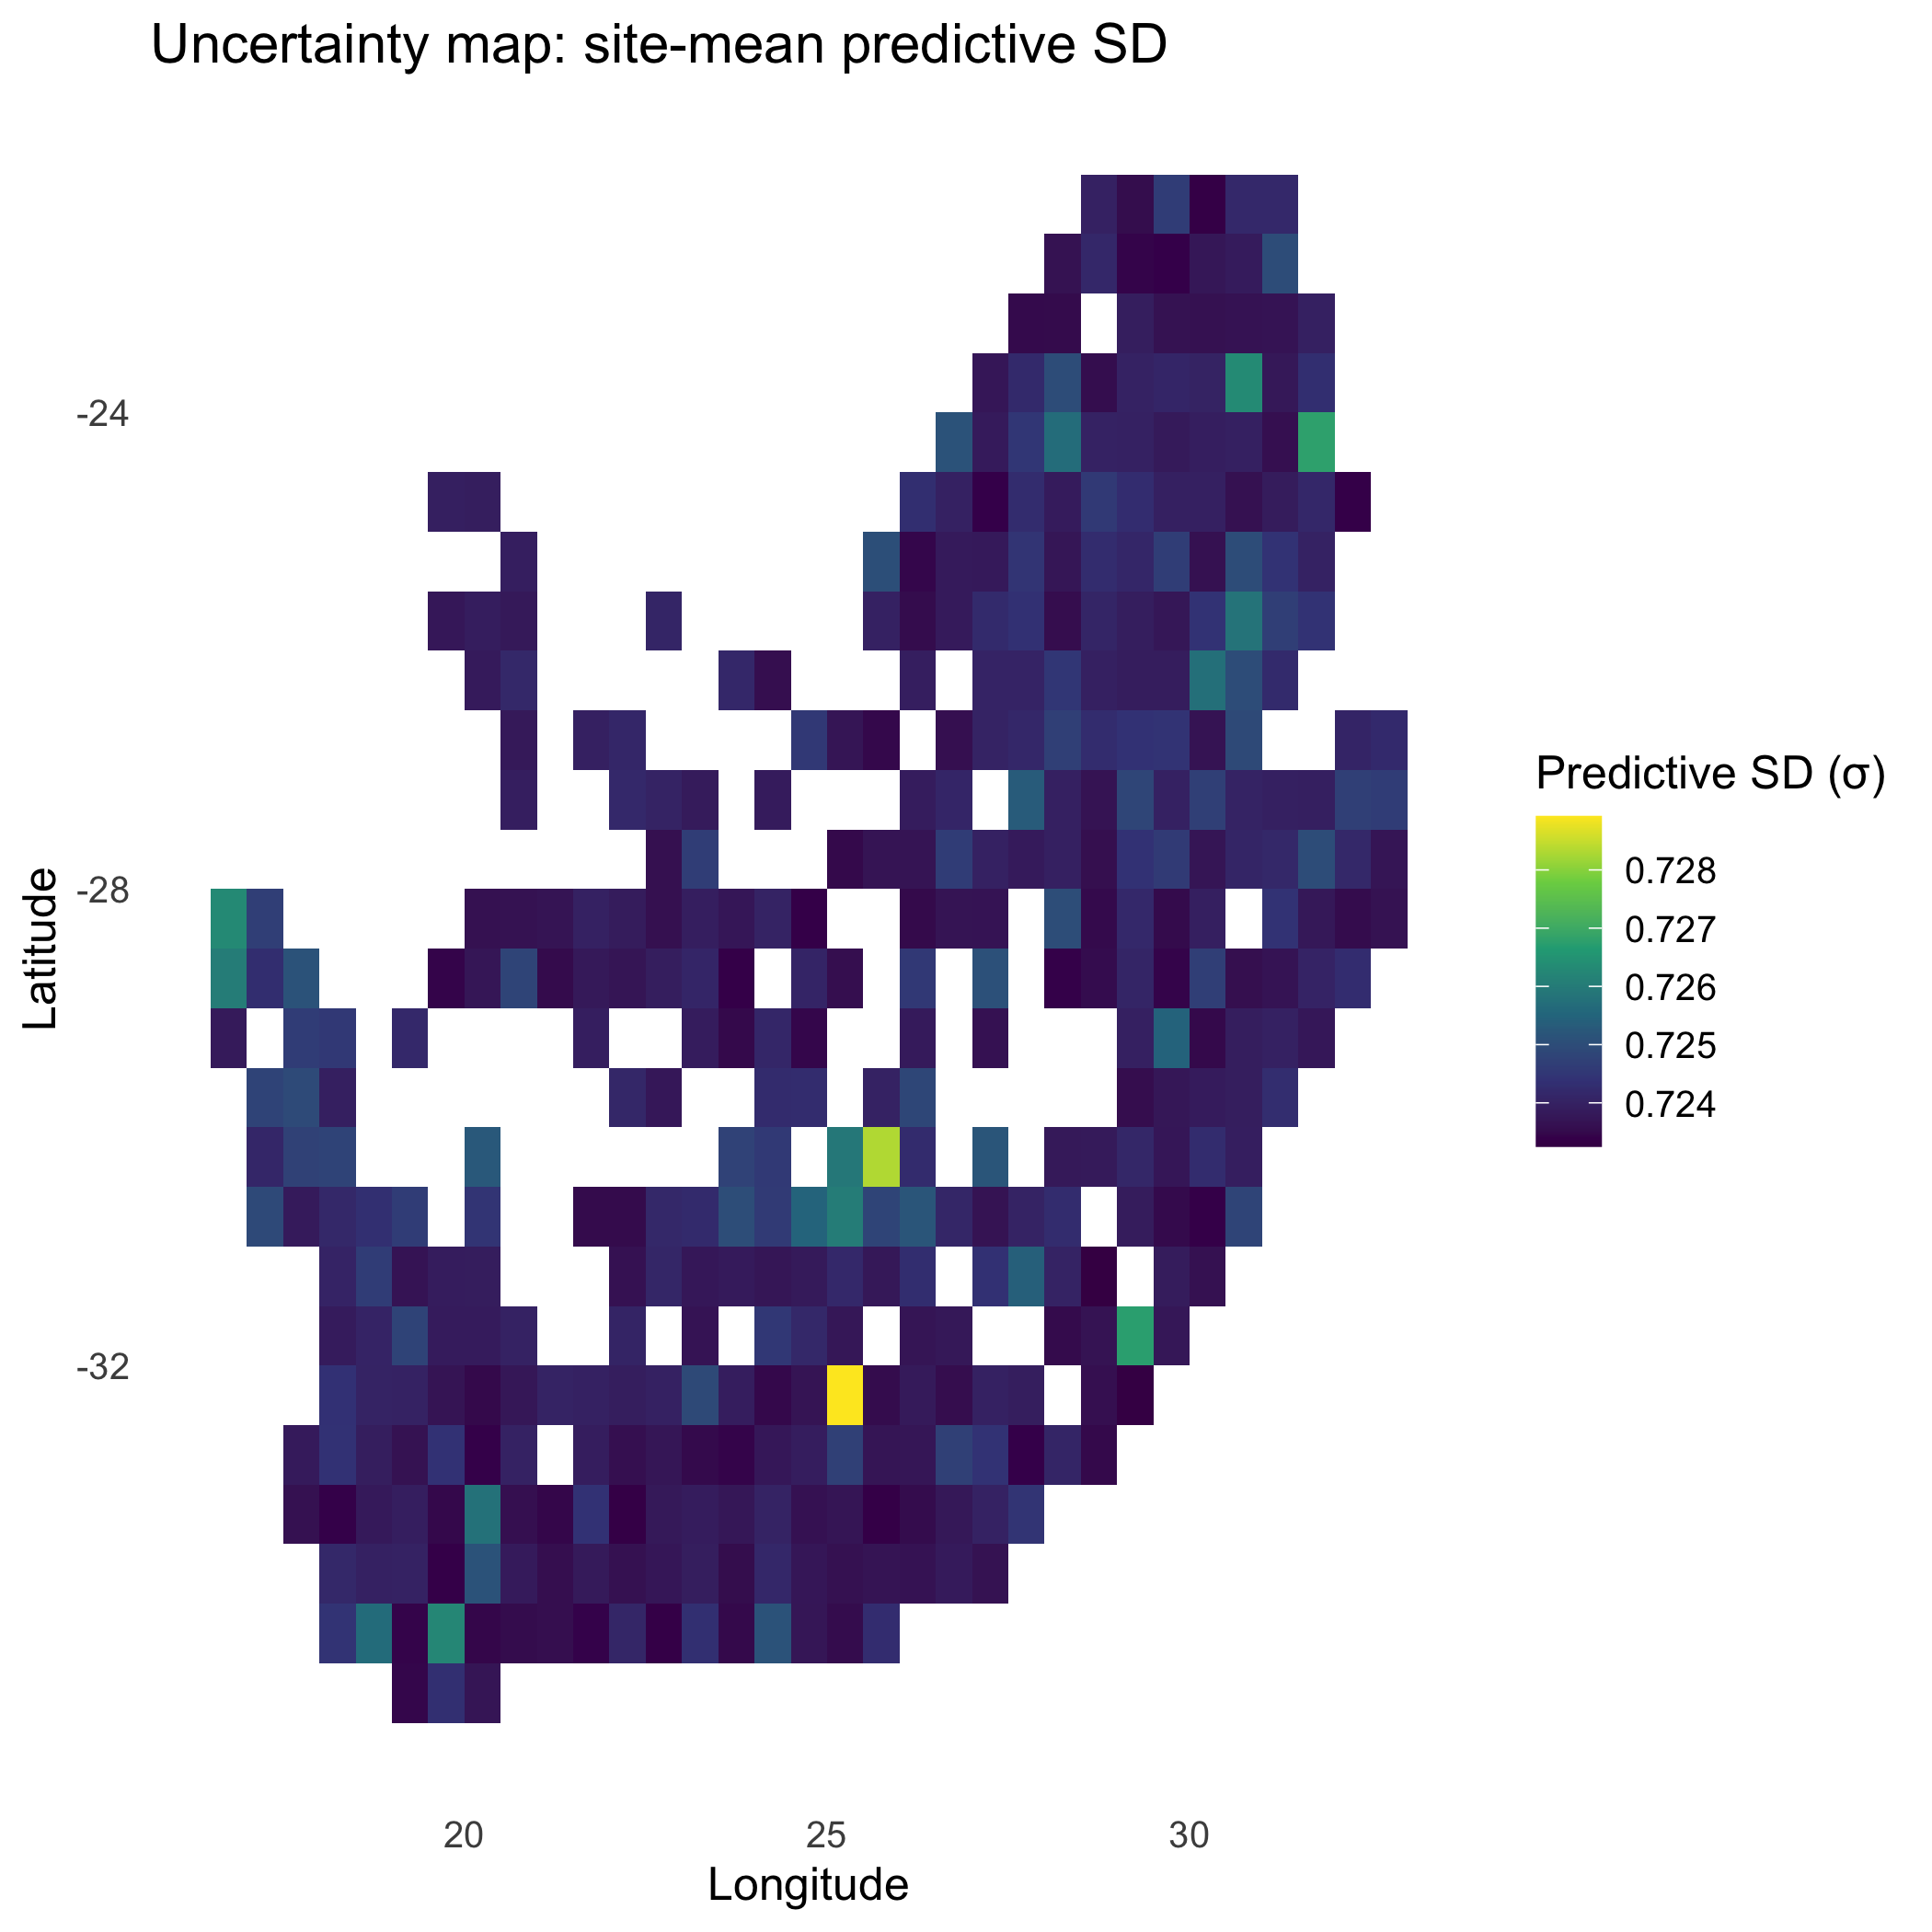
# ---- Distribution of probabilities (all invader × site) -----------------------p_hist = ggplot2::ggplot(p_long, ggplot2::aes(x = val, fill = ..x..)) + ggplot2::geom_histogram(bins = 40, color = "grey30") + ggplot2::scale_fill_viridis_c(option = "magma", guide = "none") + ggplot2::labs(title = "Probit (predictive SD): distribution of P(establishment)", x = "Probability", y = "Frequency") + ggplot2::theme_minimal(base_size = 12)print(p_hist)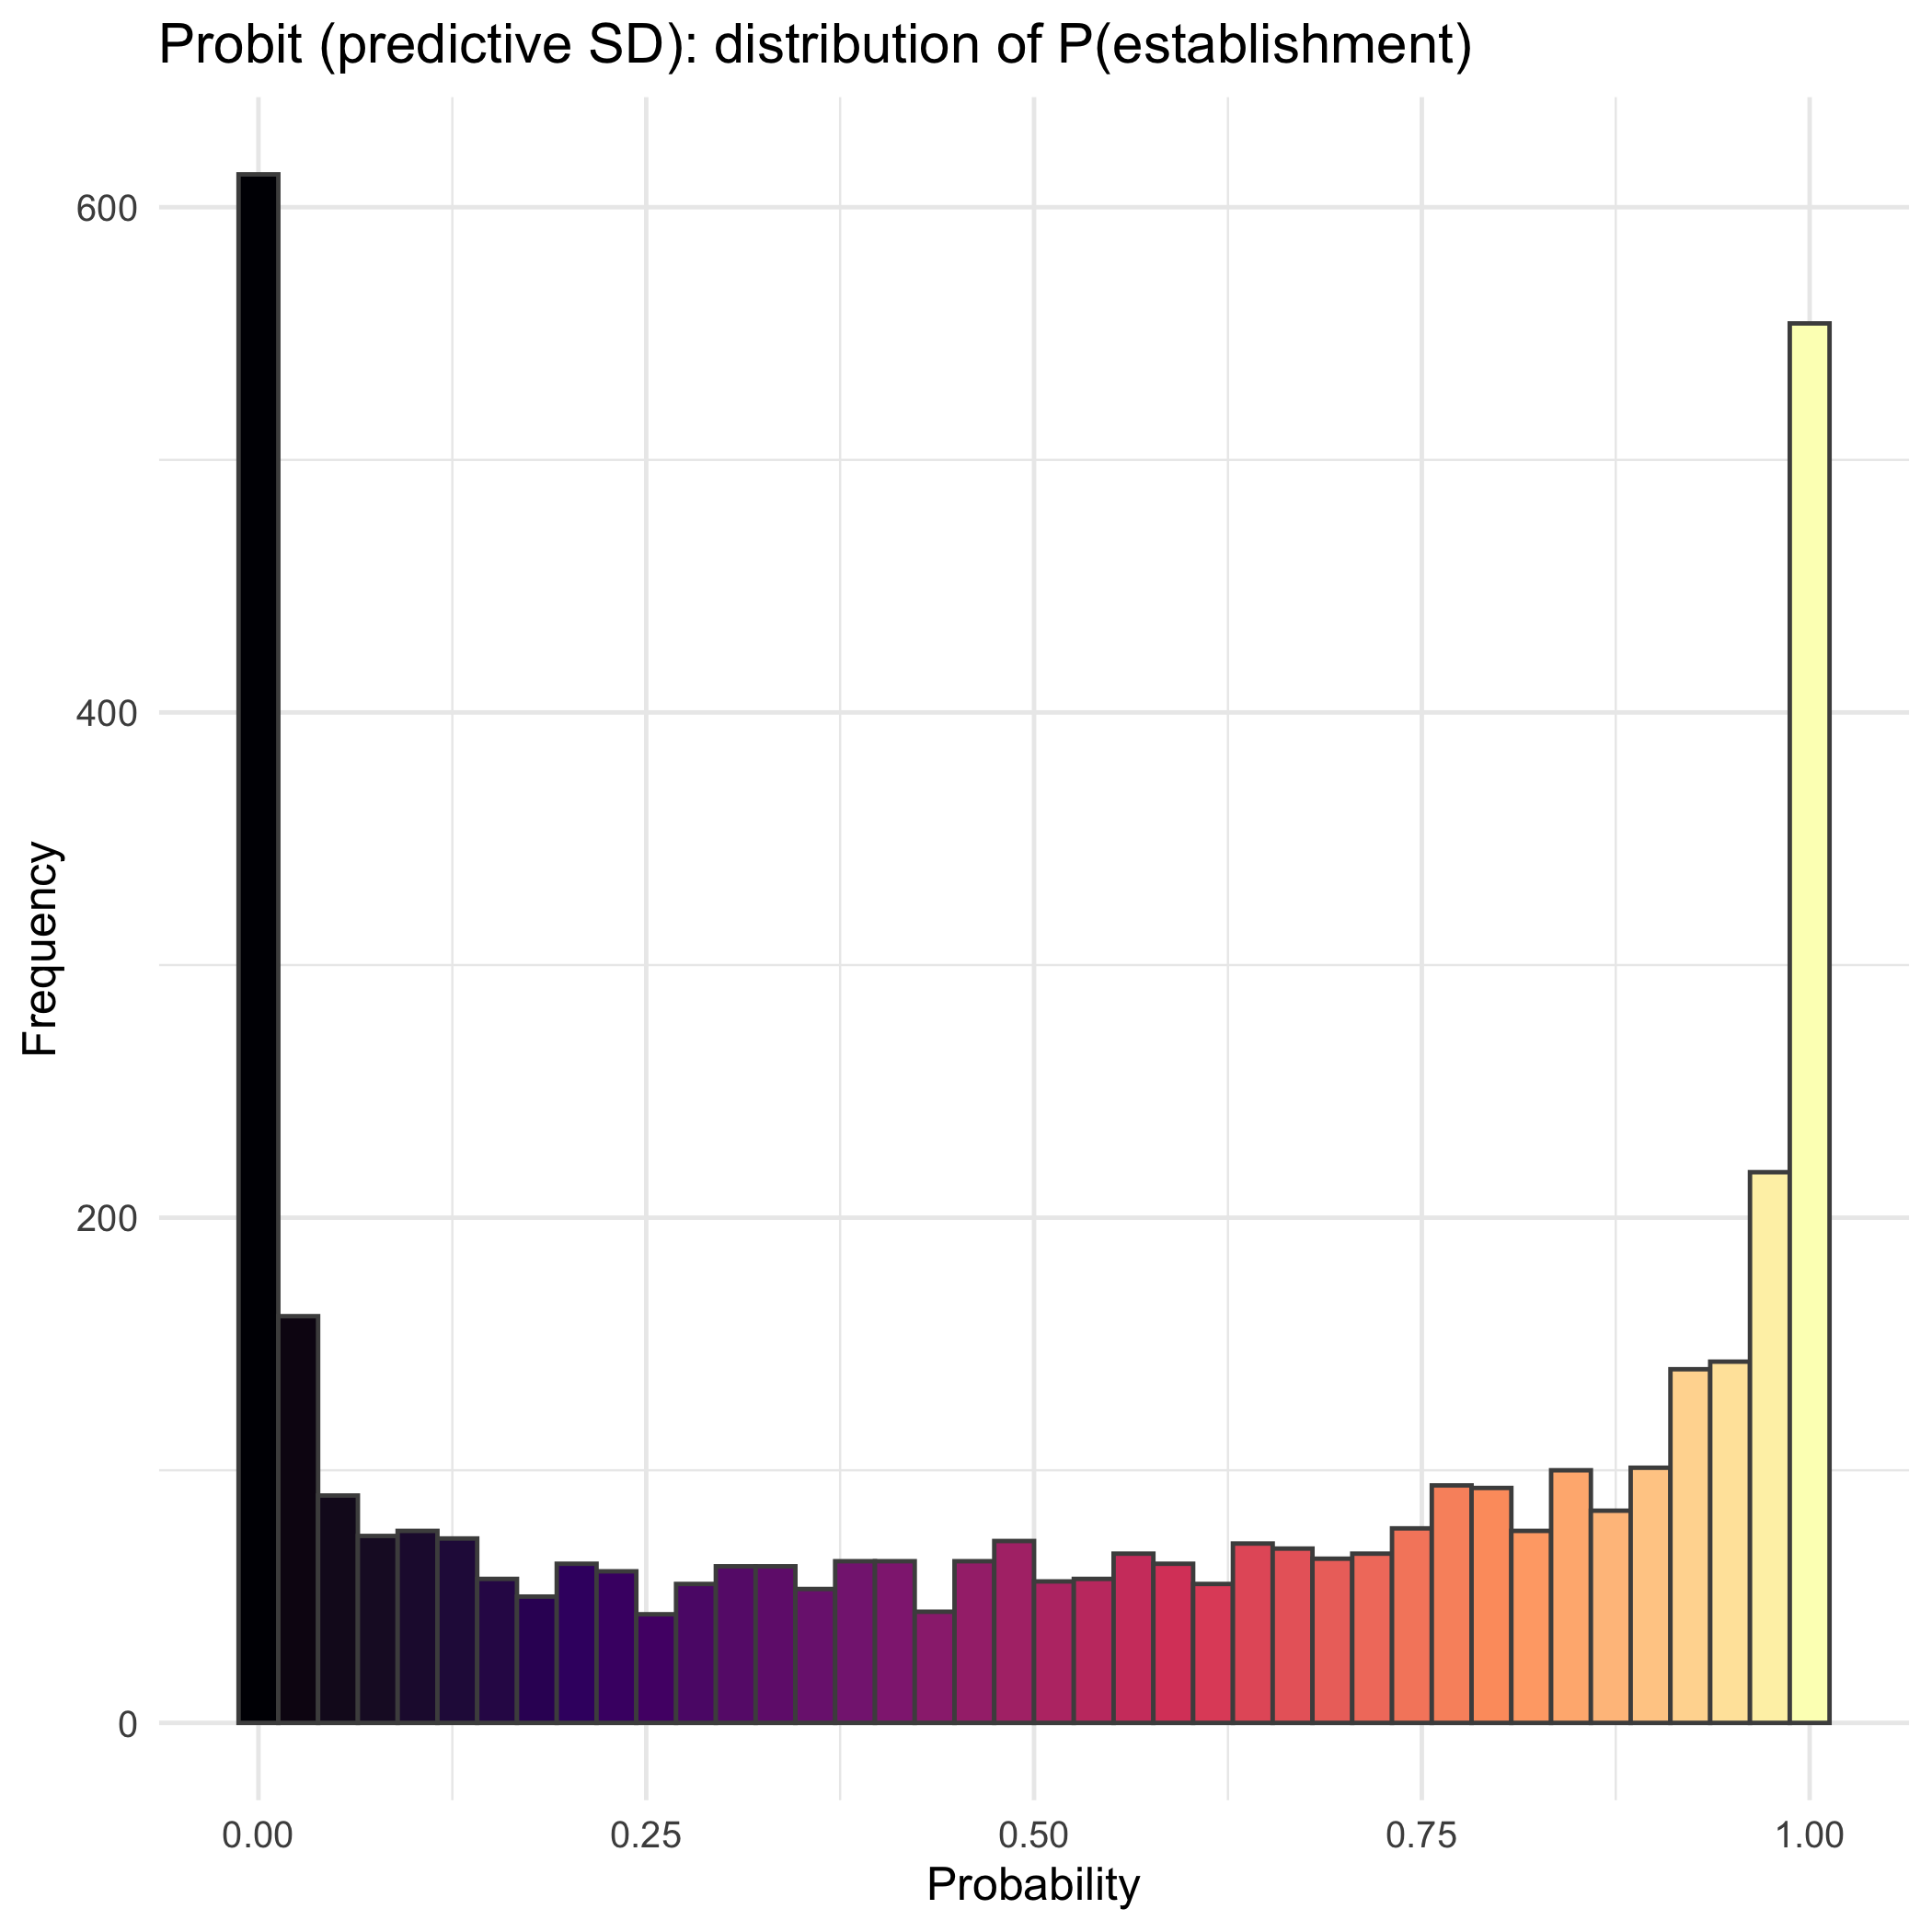
:chart_with_upwards_trend: Figure 9: Incorporating predictive SD damps extreme probabilities in low-information cells, pulling them toward 0.5. The site-mean P map highlights where establishment remains plausible after this shrinkage, while the uncertainty map (σ) pinpoints data-poor or extrapolative regions (often at trait-space edges or sparse sites) where decisions should be more cautious or targeted for new surveys.
:bulb: Interpretation: Also print the uncertainty map (site-mean
Minimal fallback when you only have
Section titled “Minimal fallback when you only have (Optional)”If
outQuick = invasimapr::compute_establishment_probability( lambda_is = lambda_is, method = "probit", sigma = 1, site_df = site_df, return_long = TRUE, make_plots = TRUE)str(outQuick, 1)#> List of 7#> $ p_is : num [1:415, 1:10] 2.77e-02 1.14e-07 1.13e-01 5.87e-01 1.01e-01 ...#> ..- attr(*, "dimnames")=List of 2#> $ lambda_is : num [1:415, 1:10] -1.92 -5.18 -1.21 0.22 -1.28 ...#> ..- attr(*, "dimnames")=List of 2#> $ sigma_used : num 1#> $ method : chr "probit"#> $ option_label: chr "probit"#> $ prob_long : tibble [4,150 × 7] (S3: tbl_df/tbl/data.frame)#> $ plots :List of 3:bar_chart: When only
# ---- Prepare long probability table ------------------------------------------p_long_q = if (!is.null(outQuick$prob_long)) outQuick$prob_long else outQuick$p_longstopifnot(!is.null(p_long_q))p_long_q = p_long_q |>  dplyr::select(site, invader, val, x, y) |>  dplyr::mutate(site = as.character(site), invader = as.character(invader))
# ---- Site-mean probability map ------------------------------------------------site_mean_q = p_long_q |>  dplyr::group_by(site, x, y) |>  dplyr::summarise(p_mean = mean(val, na.rm = TRUE), .groups = "drop")
p_site_q = ggplot2::ggplot(site_mean_q, ggplot2::aes(x = x, y = y, fill = p_mean)) +  ggplot2::geom_tile() +  ggplot2::scale_fill_viridis_c(name = "Mean P(estab.)", limits = c(0,1)) +  ggplot2::labs(title = "Quick probit (scalar σ): site-mean establishment probability",                x = "Longitude", y = "Latitude") +  ggplot2::theme_minimal(base_size = 12) +  ggplot2::theme(panel.grid = ggplot2::element_blank())if (exists("rsa")) p_site_q = p_site_q +  ggplot2::geom_sf(data = rsa, inherit.aes = FALSE, fill = NA, color = "black", size = 0.35)print(p_site_q)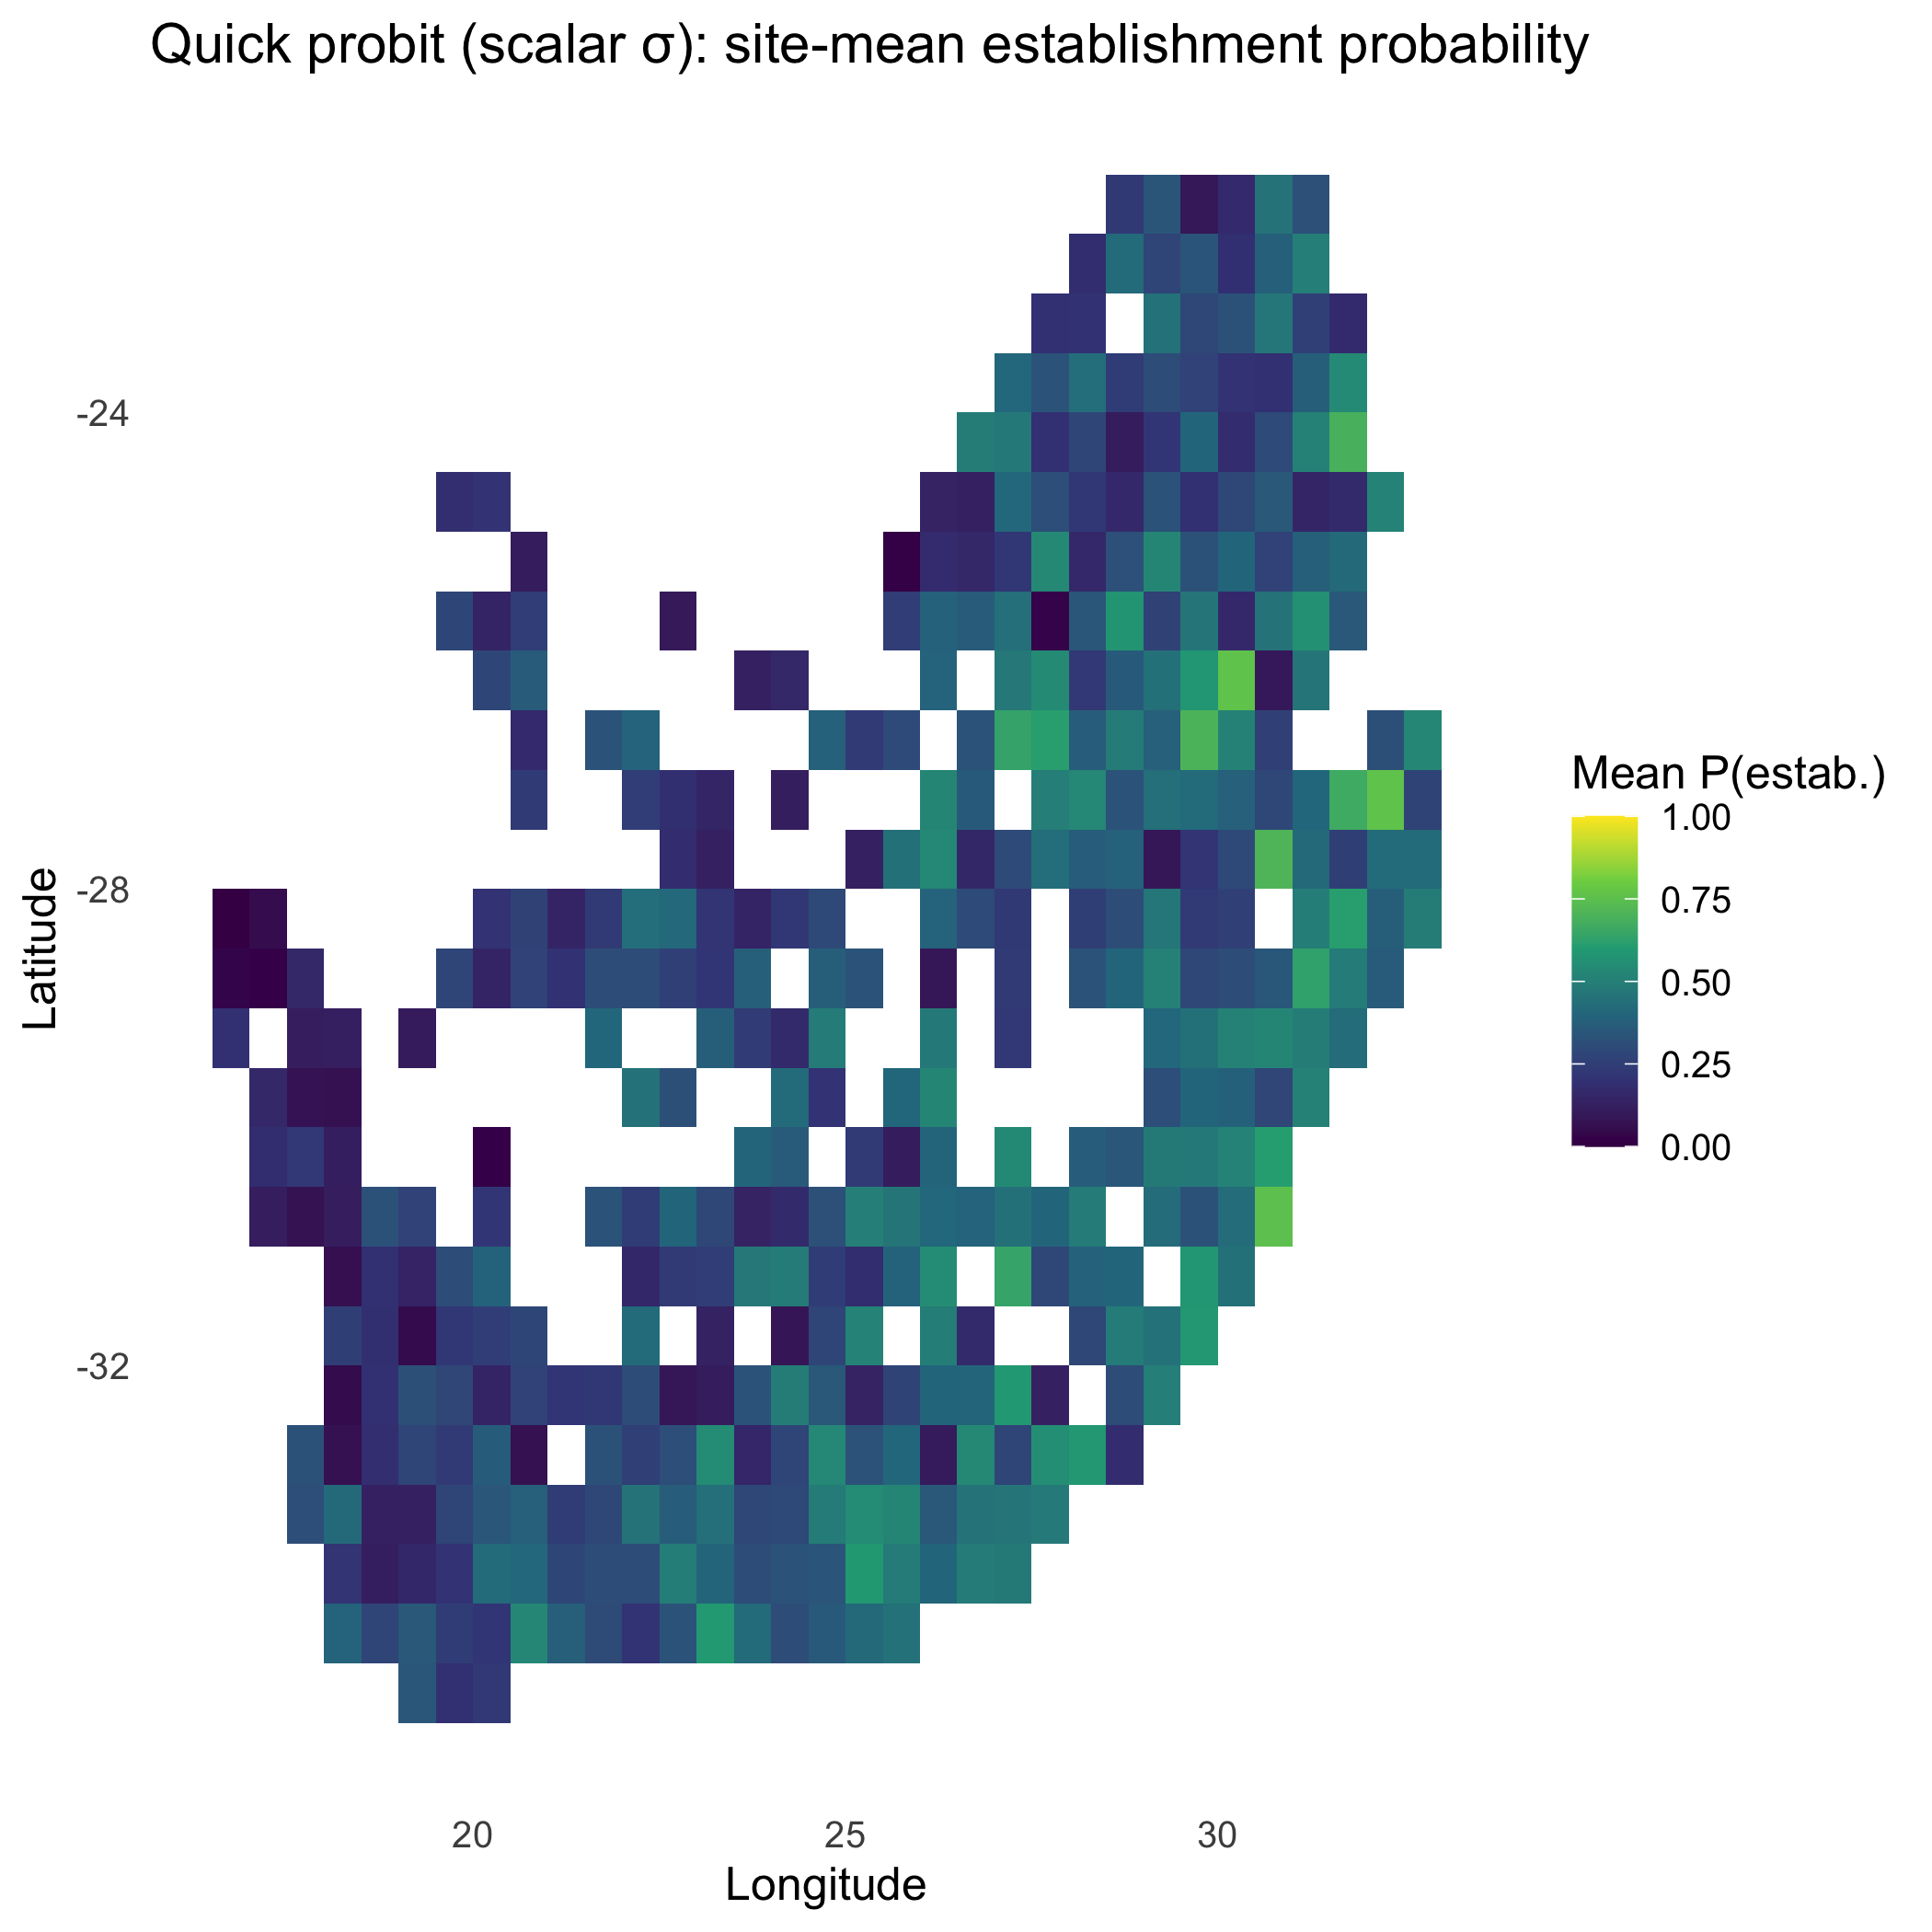
# ---- Distribution of probabilities -------------------------------------------p_hist_q = ggplot2::ggplot(p_long_q, ggplot2::aes(x = val, fill = ..x..)) + ggplot2::geom_histogram(bins = 40, color = "grey30") + ggplot2::scale_fill_viridis_c(option = "magma", guide = "none") + ggplot2::labs(title = "Quick probit (scalar σ): distribution of P(establishment)", x = "Probability", y = "Frequency") + ggplot2::theme_minimal(base_size = 12)print(p_hist_q)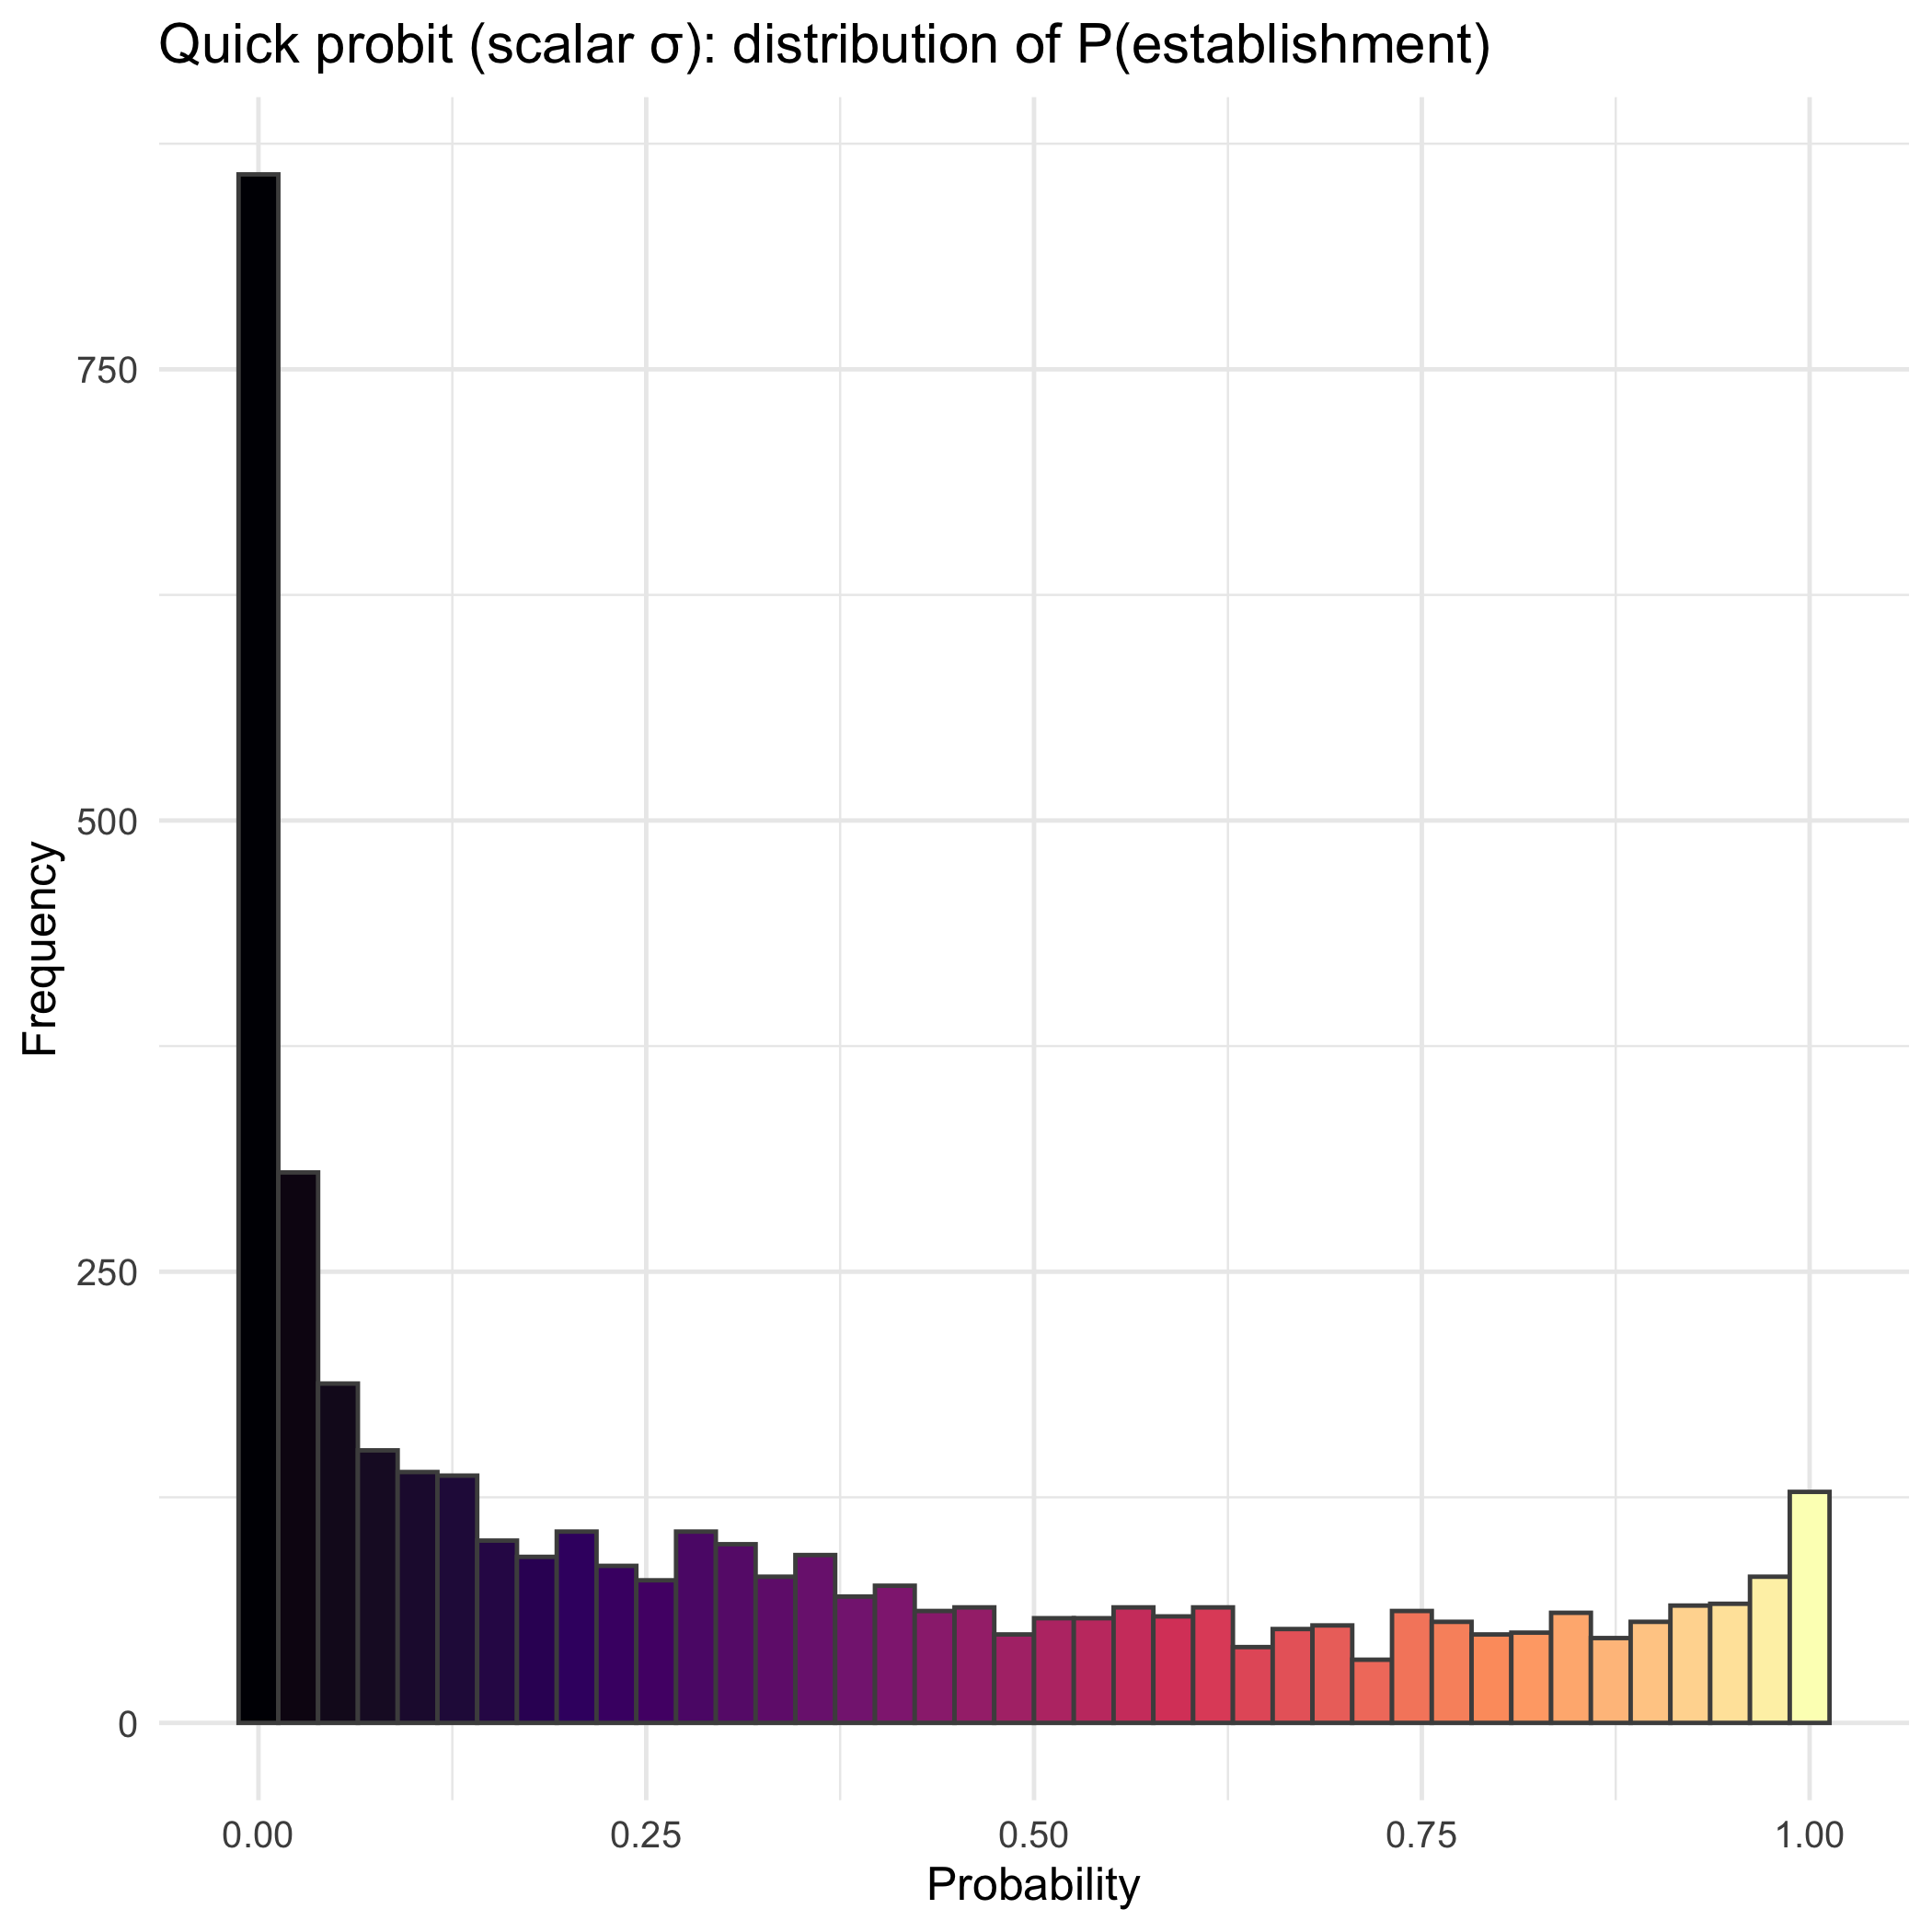
:chart_with_upwards_trend: Figure 10: Using a single, scalar
converts to probabilities quickly, preserving relative patterns but without uncertainty adaptation. High or low regions stay extreme; consider the predictive-SD approach when you need risk that reflects confidence, not just the mean signal.
:bulb: Section takeaway
Section titled “:bulb: Section takeaway”- Use Option A to anchor interpretation;
- switch to B for a single global abiotic slope;
- choose C when trait × abiotic interactions are real;
- add D when site heterogeneity matters;
- reserve E for justified facilitation.
- Then select a probability method that matches your communication needs i.e. logistic/probit for smooth risk maps, hard for thresholded planning, and probit with predictive SD when conveying uncertainty, is essential.
Session information
Section titled “Session information”sessionInfo()#> R version 4.5.3 (2026-03-11)#> Platform: aarch64-apple-darwin20#> Running under: macOS Tahoe 26.6.2#>#> Matrix products: default#> BLAS: /System/Library/Frameworks/Accelerate.framework/Versions/A/Frameworks/vecLib.framework/Versions/A/libBLAS.dylib#> LAPACK: /Library/Frameworks/R.framework/Versions/4.5-arm64/Resources/lib/libRlapack.dylib; LAPACK version 3.12.1#>#> locale:#> [1] en_US.UTF-8/en_US.UTF-8/en_US.UTF-8/C/en_US.UTF-8/en_US.UTF-8#>#> time zone: Europe/Brussels#> tzcode source: internal#>#> attached base packages:#> [1] stats graphics grDevices utils datasets methods base#>#> other attached packages:#> [1] frictionless_2.0.1 virtualspecies_1.6 geodata_0.6-9#> [4] terra_1.9-50 ggExtra_0.11.0 tidyterra_0.7.2#> [7] dplyr_1.2.1 sf_1.1-3 gcube_1.4.4#> [10] ggplot2_4.0.3 invasimapr_0.2.1 here_1.0.2#> [13] purrr_1.2.2 yaml_2.3.12#>#> loaded via a namespace (and not attached):#> [1] fs_2.1.0 matrixStats_1.5.0 lubridate_1.9.5#> [4] httr_1.4.9 RColorBrewer_1.1-3 insight_1.5.1#> [7] numDeriv_2016.8-1.1 tools_4.5.3 backports_1.5.1#> [10] utf8_1.2.6 R6_2.6.1 vegan_2.7-6#> [13] mgcv_1.9-4 permute_0.10-0 withr_3.0.3#> [16] clValid_0.7 sp_2.2-1 gridExtra_2.3.1#> [19] cli_3.6.6 performance_0.17.0 factoextra_2.2.0#> [22] sandwich_3.1-1 labeling_0.4.3 entropy_1.3.2#> [25] mvtnorm_1.4-2 S7_0.2.2 readr_2.2.0#> [28] proxy_0.4-29 pbapply_1.7-5 R.utils_2.13.0#> [31] stringdist_0.9.15 dichromat_2.0-0.1 scico_1.5.0#> [34] parallelly_1.50.0 maps_3.4.4 rstudioapi_0.17.1#> [37] FNN_1.1.4.1 shape_1.4.6.1 generics_0.1.4#> [40] b3doc_0.3.0.9000 car_3.1-5 dendextend_1.19.1#> [43] scam_1.2-23 Matrix_1.7-5 abind_1.4-8#> [46] R.methodsS3_1.8.2 lifecycle_1.0.5 dissmapr_0.2.2#> [49] multcomp_1.4-30 carData_3.0-6 recipes_1.4.0#> [52] grid_4.5.3 promises_1.5.0 miniUI_0.1.2#> [55] lattice_0.22-9 chromote_0.5.1 magick_2.9.1#> [58] pillar_1.11.1 knitr_1.52 boot_1.3-32#> [61] spacetime_1.3-3 estimability_2.0.0 pak_0.10.0#> [64] future.apply_1.21.0 codetools_0.2-20 wk_0.9.5#> [67] glue_1.8.1 data.table_1.18.6.1 vctrs_0.7.3#> [70] spam_2.11-4 Rdpack_2.6.6 gtable_0.3.6#> [73] assertthat_0.2.1 gower_1.0.2 xfun_0.62#> [76] rbibutils_2.4.1 mime_0.13 prodlim_2026.03.11#> [79] rnaturalearth_1.0.1 coda_0.19-4.1 reformulas_0.4.4#> [82] survival_3.8-6 timeDate_4052.112 pheatmap_1.0.13#> [85] iterators_1.0.14 hardhat_1.4.3 units_1.0-1#> [88] lava_1.10 fields_18.0 TH.data_1.1-3#> [91] ipred_0.9-16 nlme_3.1-169 xts_0.14.2#> [94] zetadiv_1.3.0 rprojroot_2.1.1 TMB_1.9.17#> [97] KernSmooth_2.23-26 otel_0.3.0 rpart_4.1.24#> [100] DBI_1.3.0 raster_3.6-32 nnet_7.3-20#> [103] ade4_1.7-24 mnormt_2.1.2 tidyselect_1.2.1#> [106] processx_3.9.0 emmeans_2.0.4 compiler_4.5.3#> [109] curl_8.1.0 glmnet_5.0 rvest_1.0.4#> [112] gstat_2.1-6 xml2_1.6.0 scales_1.4.0#> [115] classInt_0.4-11 fuzzyjoin_0.1.8 callr_3.8.0#> [118] rappdirs_0.3.4 stringr_1.6.0 digest_0.6.39#> [121] minqa_1.2.8 rmarkdown_2.32 htmltools_0.5.9#> [124] pkgconfig_2.0.3 lme4_2.1-0 fastmap_1.2.0#> [127] rlang_1.3.0 shiny_1.11.1 farver_2.1.2#> [130] zoo_1.9-1 jsonlite_2.0.0 mclust_6.1.3#> [133] ModelMetrics_1.2.2.2 R.oo_1.27.1 magrittr_2.0.5#> [136] Formula_1.2-6 s2_1.1.13 dotCall64_1.2#> [139] NbClust_3.0.1 patchwork_1.3.2 geosphere_1.6-8#> [142] Rcpp_1.1.2 viridis_0.6.5 stringi_1.8.9#> [145] pROC_1.19.1 MASS_7.3-66 plyr_1.8.9#> [148] parallel_4.5.3 listenv_1.1.0 ggrepel_0.9.8#> [151] forcats_1.0.1 splines_4.5.3 hms_1.1.4#> [154] ps_1.9.3 ggpubr_1.0.0 ggsignif_0.6.4#> [157] reshape2_1.4.5 stats4_4.5.3 evaluate_1.0.5#> [160] nloptr_2.2.1 tzdb_0.5.0 selectr_0.5-1#> [163] foreach_1.5.2 httpuv_1.6.17 tidyr_1.3.2#> [166] future_1.82.0 broom_1.0.13 xtable_1.8-8#> [169] ClustGeo_2.1 e1071_1.7-17 rstatix_1.1.0#> [172] later_1.4.8 viridisLite_0.4.3 class_7.3-23#> [175] intervals_0.15.5 tibble_3.3.1 websocket_1.4.4#> [178] glmmTMB_1.1.14 cluster_2.1.8.2 corrplot_0.95#> [181] timechange_0.4.0 globals_0.20.0 caret_7.0-1